Tag: Opportunities

Why does it always rain on me?

The sound of rain can be heard on roofs throughout the east coast. This will be welcome to some and a hindrance to others. In this update we take a look at futures for next year, and the last two days deluge.


It is always important to look towards the horizon when creating a strategy for grain marketing. This is especially true this year, as producers in Australia are all likely to receive a historically high price due to the local drought conditions. There isn’t much strategy really required in a year like this.

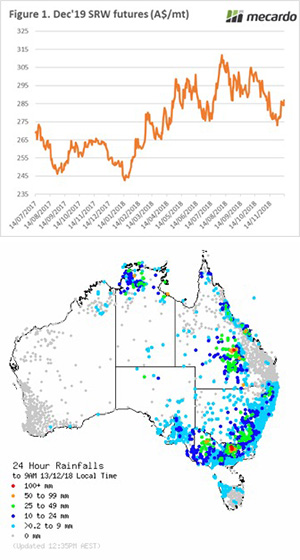
We don’t however know what the outcome will be for next year, will we have a big or small crop? Therefore, it is important to start considering forward sales.  Since the start of the month the December 2019 CBOT wheat contract has increased by 4%, from A$275/mt to A$287/mt (Figure 1). As we move forward into the northern hemisphere risk market, opportunities may present themselves.

Locally the east coast of Australia has received a deluge of rainfall with reports of over 200mm in 24 hours. Technically that will leave many with above average rainfall for the season. Unfortunately, it didn’t arrive at the right time for many.

The rainfall will cause more delays to harvesting, and likely downgrading to quality in Victoria. On a positive note, it will provide some subsoil moisture for next season and place a floor in sorghum production.

The delay in harvest may provide a lift in prices between now and Christmas for prompt delivery, as consumers attempt to gain access to feed.

What does it mean/next week?

There is a meeting in Russia next week to discuss the wheat export pace. The inevitable rumors of an export ban are back to the fore.

It is unlikely that an export ban will be put in place, a more likely result would be some form of curbs. However either action would result in a move back to US exports becoming competitive.

Throughput levels and price volatility.

South Australian mutton displays a higher degree of price volatility than their counterparts in NSW and Victorian markets. Indeed, over the 2018 season, SA mutton has experienced a range in price more than 300¢ compared to the 135¢ to 180¢ range displayed by NSW and Victorian mutton, respectively.

Analysis of the price behaviour of mutton in the southeastern mainland markets highlights the close relationship between mutton prices in Victoria and NSW. Since the beginning of 2018, the weekly mutton price in Victoria and NSW hasn’t been more than 40-50¢ apart and have followed each other relatively faithfully (Figure 1).

In contrast, while the broad trend for SA mutton has been following the pattern set by Victorian and NSW markets, there have been times in the season where SA prices have diverged wildly. There have been several occasions throughout the current year when SA mutton prices have moved beyond a 100¢ discount to Victorian/NSW prices and one time when the discount breached 220¢.

Measuring the relative weekly gain or decline in mutton prices for the three states from the beginning of the season in percentage terms helps to quantify the volatility inherent in SA mutton price movements (Figure 2).

SA mutton has seen price falls extend to nearly 30% during May and gains as high as 55% during this season. Victorian mutton prices have been as much as 26% below and 12% above the January opening price. NSW mutton has fared slightly better over the season, posting a 13% price decline and an 18% gain.

What does it mean/next week?

Analysis of weekly throughput levels this season shows that in NSW mutton numbers have averaged around 15,000 head. The higher volumes seem to help reduce price variability as individual lines of stock contribute a smaller proportion to the average prices reported in any given week. As a result, a poorer or better sales outcome doesn’t impact the average price across all sales.

This inverse relationship between price volatility and throughput volumes is also evident in the Victorian mutton data. There has been an average of around 7,000 head of mutton a week at Victorian saleyards this season, which is just under half the NSW average. The price volatility in Victoria has been slightly higher than in NSW.

Similarly, SA reports average weekly mutton throughput of around 1,200 head and the price variability between weeks is significantly higher than other two states (Figure 3). The thinner volumes mean that average prices are more susceptible to influence by poorer or better sales outcomes on a given week. Yards with higher volumes will attract more buyers, bringing greater competition which in turn means that prices can’t be manipulated by a single buyer or small group of buyers with market power.

Key points:

  • Weekly mutton prices for Victoria and NSW are rarely more than 40-50¢ apart and show a lower degree of volatility than SA mutton prices, week on week.
  • SA mutton prices have ranged over 300¢ in price during the 2018 season, compared to 135¢ NSW and 180¢ for Victoria.
  • Higher throughput volumes appear to be synonymous with greater price stability.

Volatile times ahead for feedlot utilisation

Feedlot utilisation levels are a key performance indicator of feedlot operations. Using saleyard data that indicates buyer behaviour of feeder cattle, we have created a forecast model for feedlot capacity utilisation as we head toward 2020.

Utilisation numbers as an indicator of feedlot performance are the preferred index relative to total numbers of cattle on feed, traditionally highlighted as an indicator of industry performance. By accounting for the number of cattle on feed as proportionate to total capacity, we are best able to visualise how feedlots are using the available resources and infrastructure that is available in the industry.

Historical movement in feedlot capacity and utilisation levels demonstrate that capacity increases do not always result in high utilisation of the existing feedlot infrastructure (Figure 1).

While the past two quarters have seen an increase in the number of cattle on feed to consecutive record-breaking numbers, it was not a sign of greater profitability. Utilisation for the past two years has remained volatile but relatively high, between 75-86% utilisation nationally.

The past quarter has seen its fair share of struggles in the feedlot industry. High grain prices, a poor harvest with limited roughage availability and fires in southern Queensland will all place significant difficulties on the feedlot margins going forward into this quarter.

Accounting for these recent developments, combined with weather forecasts, currency outlooks and emerging saleyard trends, we are looking to see Feedlot utilisation levels fall to their lowest point since September 2016 to around 72%.

Capacity changes are expected to have little to no impact on this forecast, with growth last quarter changing less than 1% nationally.

What does it mean?

The prospect of lower levels of feedlot utilisation, toward levels that we have not seen for a while, could reduce the demand for feed grain and other feedlot inputs going forward. Feedlot marketing’s of grain-fed cattle would likely follow the utilisation drop in early 2019; something else to look out for in the new year.

Into the second half of 2019 the model estimates that feedlots will be looking to restock as the utilisation levels are forecast to climb back toward the 85% area. This is potentially a good time for producers with feeder steers to bring them into the saleyard.

Key points:

  • A volatile 24 months has been seen in feedlot utilisation, bouncing between 75-86% utilisation.
  • Utilisation model forecasting tips feedlots to be at around 70% capacity for the coming quarter.
  • The second half of 2019 forecasts a recovery in feedlot utilisation numbers; a good time maybe to have feeder steers in the saleyards.

Flush nearing completion.

Victorian lamb numbers continue to swell, hitting levels similar to last year’s peak and pushing East coast lamb numbers to levels not seen since January 2018. Sheep numbers at the sale yard have also rebounded over the last few weeks and the result has been softer lamb and mutton prices across the board.

East coast sale yard prices for the commonly NLRS reported categories of lamb and mutton are outlined in Figure 1 and it shows that the increased throughput having an impact on all prices, although only minor falls registered for Merino Lamb and Mutton.

Restocker Lambs taking the biggest hit with an 8% drop to close at 654¢/kg cwt. The Eastern States Trade Lamb Indicator (ESTLI) posting a more modest 3% fall to finish the week at 663¢/kg cwt. Interestingly, we are now nearing the area we originally suggested the ESTLI was likely to bottom out once the Spring flush was competed.

Back in October we released an analysis piece suggesting the bottom would be found around the 630-650¢ level in late November. Granted, we are little late with the timing but its near enough now to call the bottom for the ESTLI given there can’t be too much more of the Spring flush to play out.

Victorian lamb yardings gaining 25% week on week to see 148,298 head recorded. This time last season the Victorian yardings peaked at 147,363 so it is fair to expect there can’t be much more lambs to come in the next few weeks. East coast lamb yardings boosted by the Victorian flow, registering just short of 300,000 head presented, to see the highest weekly total throughput since the start of the season – Figure 2.

A similar story for east coast mutton throughput too this week with a 15% gain in numbers week on week to see nearly 123,000 head yarded. A surprising number of sheep still being offered up, given the elevated yarding we have been seeing along the east coast since the middle of the year.

What does it mean/next week?:

The next week has some pretty good rainfall forecast for much of Victoria and Southern NSW, with up to 50mm expected across a broad area. This is likely to encourage any remaining stock to be held a little longer by producers so expect prices to stabilise and don’t be surprised to see a little kick higher as we head toward the Xmas break.

Merino carries on but crossbreds concede

Last week we saw the wool market settle and this week was much the same for the Merino market. Although, that can’t be said for the whole wool market, the crossbred section ran to it’s tipping point and conceded significantly on previous levels.

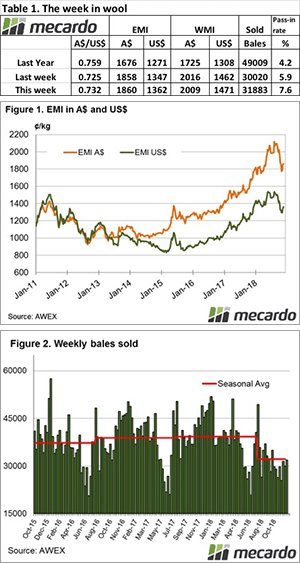
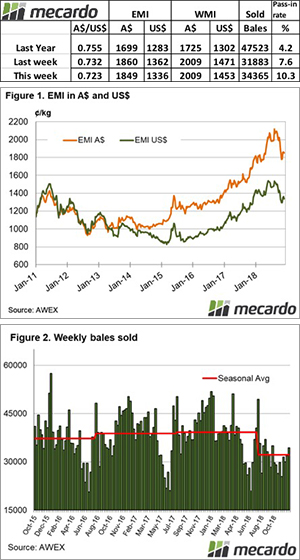
The Eastern Market Indicator (EMI) fell slightly, ending the week at 1849 cents. The Au$ was weaker, closing at 0.723 US cents. That put the EMI in US$ terms at 1,336 cents, a loss of 25 cents (Table 1).

In the west, the Western Market Indicator (WMI) was unchanged on the week at 2009 cents.

Compared to the original roster posted last week, 38,315 of the 39,500 bales intended for sale this week came to the market. The solid market meant growers only passed in 10.3% of bales offered. This resulted in a clearance to the trade for the week of 34,365 bales (Figure 2). In the auction weeks since the winter recess, 580,389 bales have been cleared to the trade.

The dollar value for the week was $69.98 million, for a combined value of $1.47 billion so far this season.

The crossbred sections rally came to an end this week. Wool greater than 30 micron lost between 50 and 130 cents. AWEX reported that the sharp reduction in price was met with firm seller resistance with nearly 20% of crossbred wool being passed in.

Merino fleece had a solid week, particularly in the North. Most microns posted small increases.  The oddments market fell between 10 and 20 cents.

The week ahead

Christmas is just around the corner, at least for the wool market, with 1 more week of sale prior to the break. 48,777 bales are on offer across the three selling centres on Wednesday and Thursday.

Holding pattern continues

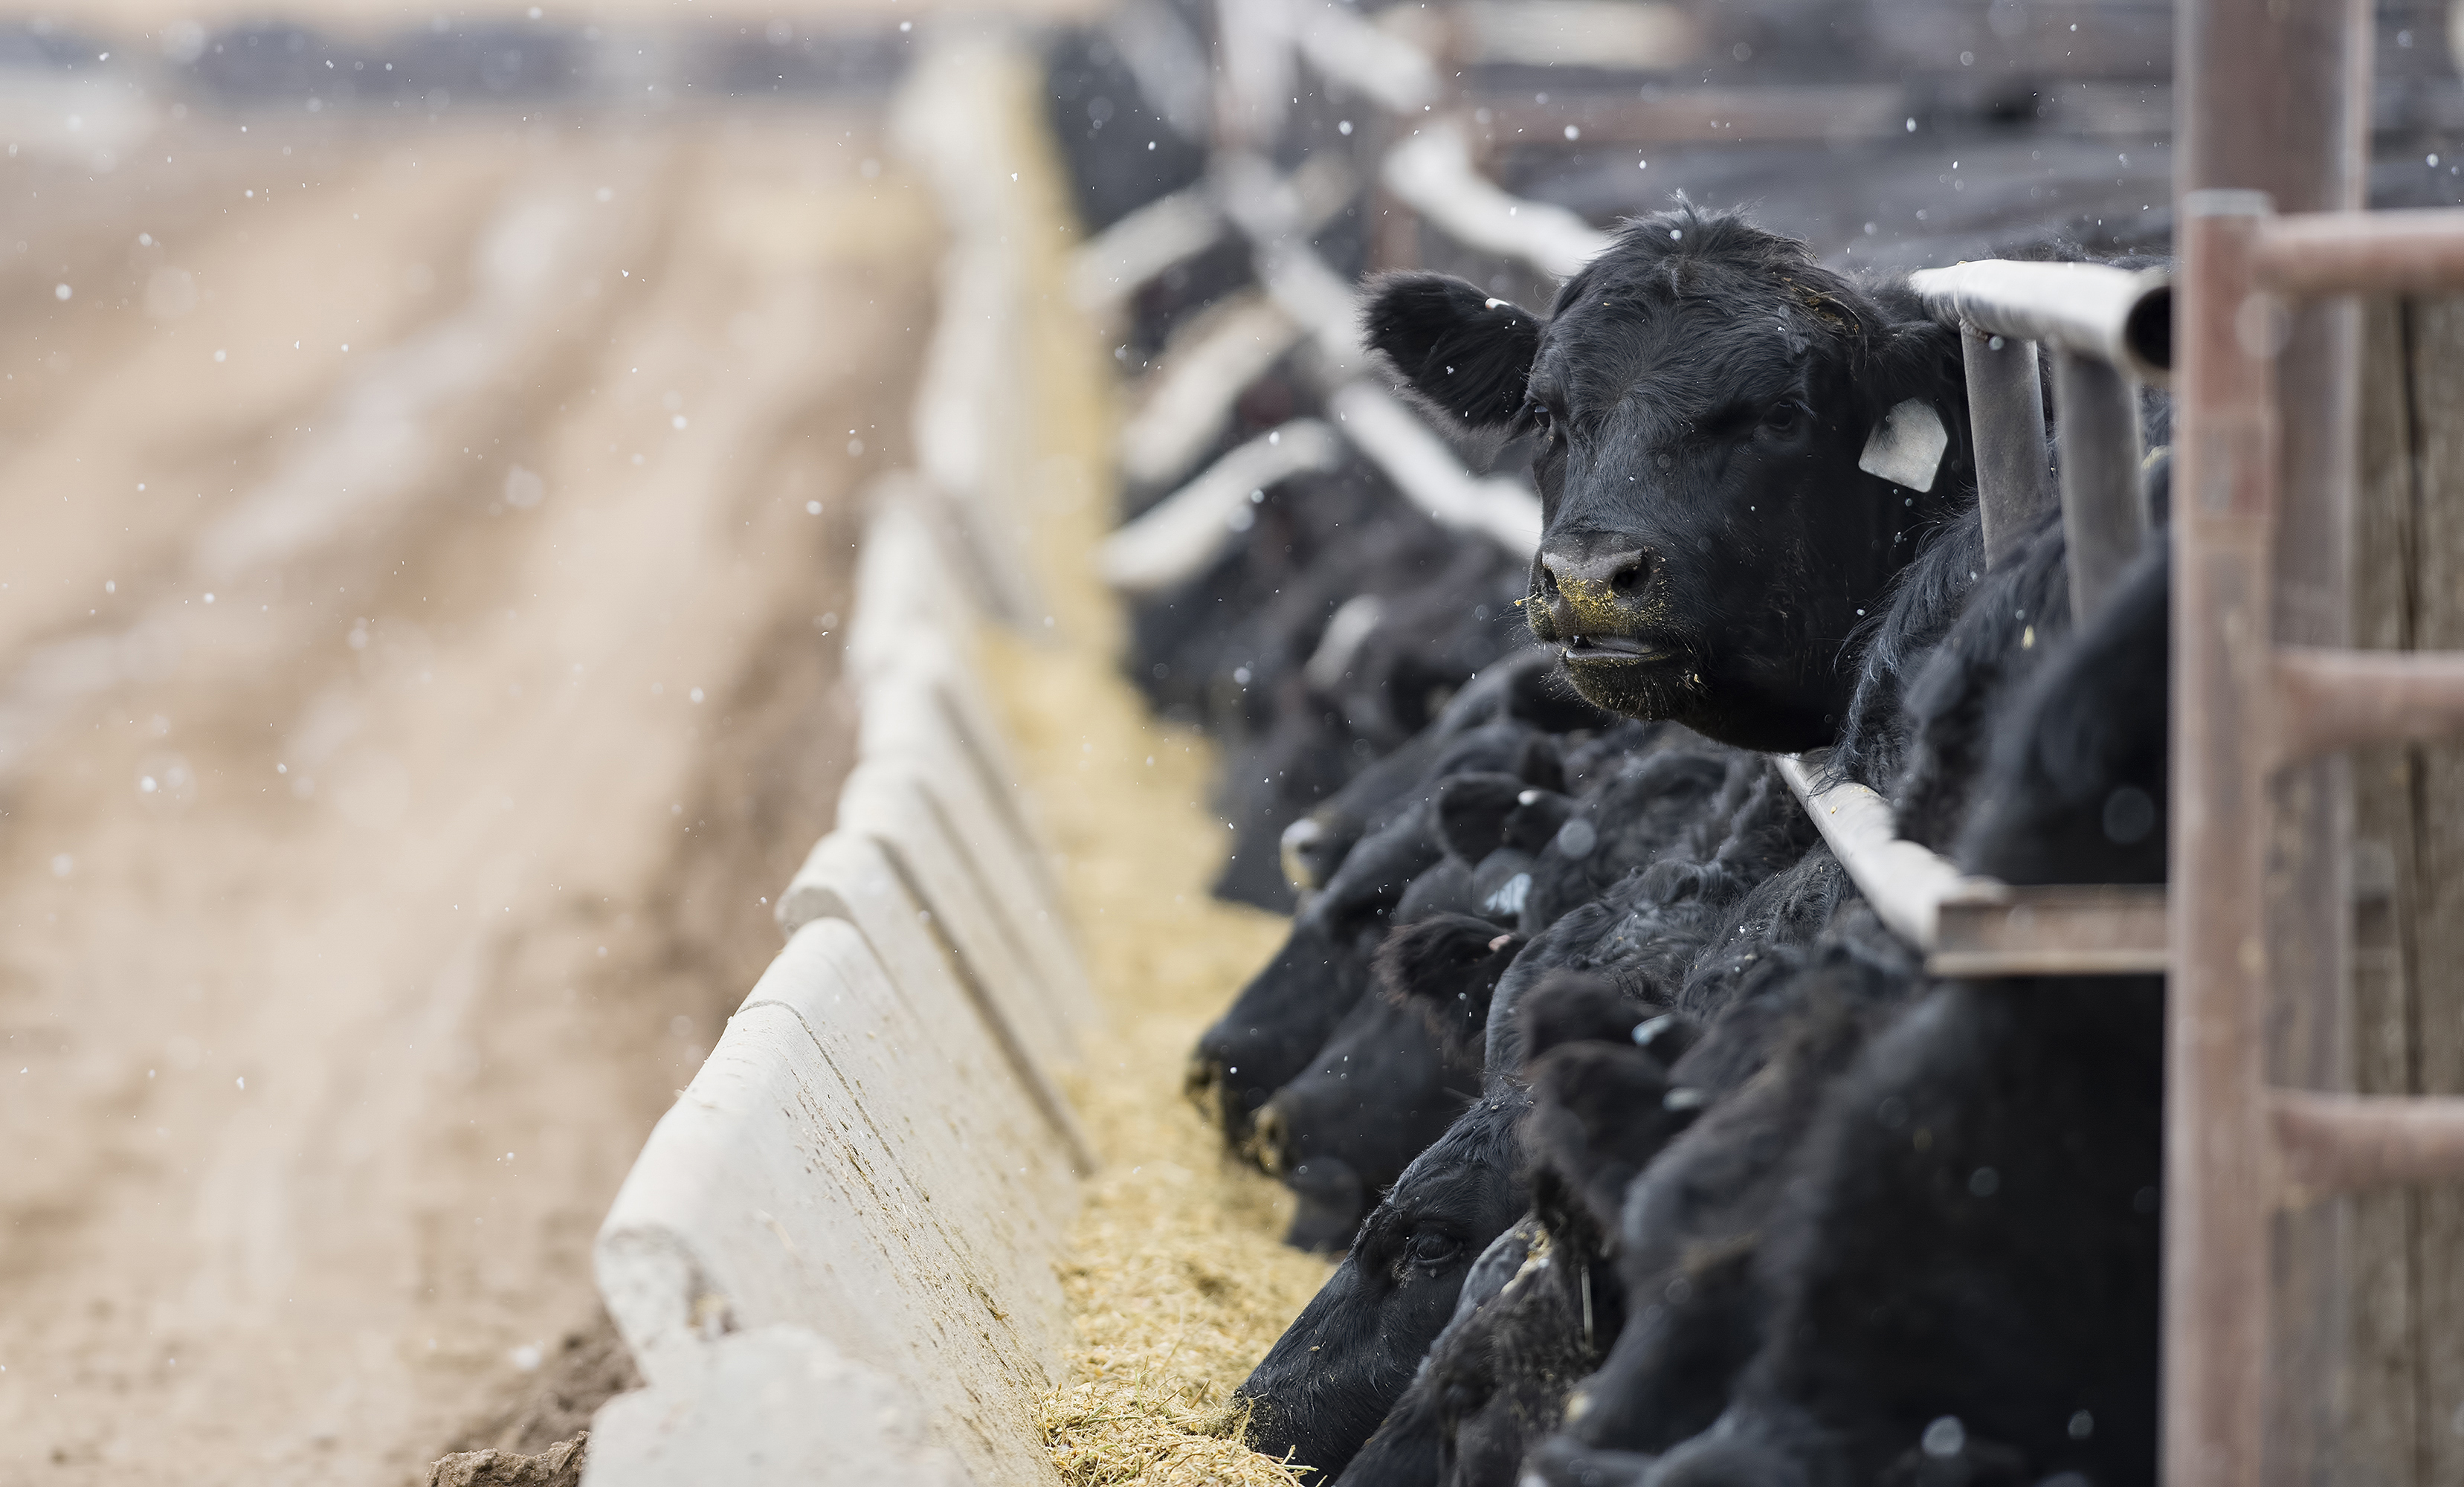
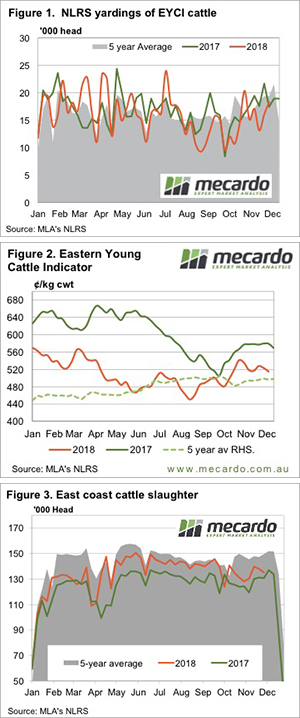
Cattle markets continue their holding pattern this week as all eyes are on the forecast, looking for the season breaking summer rains.  Finished cattle supplies appear to be easing ever so slightly, and this will support finished prices.

While most are waiting for the rain, some bit the bullet this week and send young cattle to the market.  Figure 1 shows Eastern Young Cattle Indicator (EYCI) yardings hitting a five week high, and posting the second highest level since July.

It has been a dry week, and with little real precipitation on the forecast, the increased yardings saw the EYCI ease (figure 2).  Demand remains good, with feeder, processors and restockers all seemingly comfortable with current levels.

There are some signs that the spring flush of cattle might be coming to an end.  Figure 3 shows east coast slaughter declining for the second week in a row.  The trajectory has slaughter numbers hitting last year’s levels for the first time since April, and it hasn’t happened many times this year.

While the EYCI is sitting 11% behind the same time last year, heavy steers remain strong, they are 9.5% above the level of 2017.  Expensive grain and a lack of grass is making processors pay up for the finished product.

Interestingly heavy young cattle, the type which are heavy enough for the feedlot, are still at a premium to the same time last year.  This is a good indication of how hard it has been to get weight into cattle on grass.

What does it mean/next week?

With no real rain on the forecast we could head in to the Christmas break with young cattle prices on the slide.  It is a sure thing that the market will move in January, but which way depends on the weather. A dry end to December will mean prices open lower, while a wet break will see a stronger opening and will be a boon for the weaner sales.

A crude harvest present

Those who are lucky enough to be still harvesting are receiving an early Christmas present in the form of a reduced fuel bill. Diesel is one of the biggest costs on farm, so it’s worthwhile looking at this downward move.


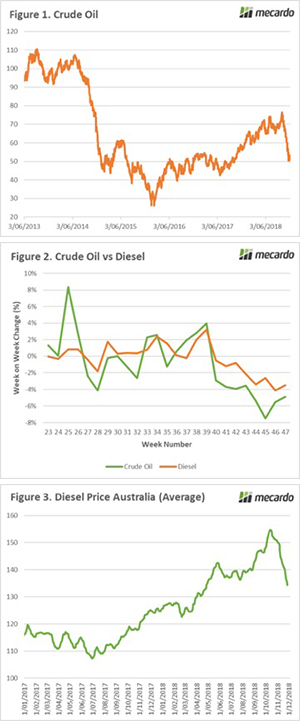
In mid-September, I covered fuel in the sarcastically titled ‘The great fuel robbery of 2018’. During this time fuel prices in Australia had risen dramatically to the highest since 2014. This led to calls to boycott the fuel companies. My view, in this case, was that boycotting the fuel companies was an ineffective action as the price of fuel is based on factors largely out with the fuel stations control. It is a function of commodity pricing.

In early October crude oil futures reached a four-year peak (Figure 1). The market has fallen dramatically since then. Diesel is a derivative of crude oil therefore when crude falls, in theory so should diesel (and vice versa).

To show this, I examined the weekly change in price between crude oil and diesel over the past six months. In figure 2 the movement in price (as a %) is displayed, clearly showing a strong relationship. This chart uses a lag of one week, which signifies that there is a delay between the value in crude moving and diesel prices.

The correlation between the two commodities is displayed below, with 1 being a perfect correlation and 0 being no correlation.

  • 0 lag : 0.33
  • 1 week lag :78
  • 2 week lag :66
  • 3 week lag :41

The result of this downward movement in crude has been that diesel prices in Australia have started to reflect the fall (Figure 3). This means that any purchases at present should be considerably cheaper than pre-harvest which will be welcome to all.

What does it mean/next week?:

November was the weakest month for crude oil futures during the past decade. This is due to supply outstripping demand, with US stockpiles at record highs in recent months.

Prices are likely to stay weak until we see either an improvement in global economic growth or production curbs enacted by OPEC.

Key Points

  • Diesel is a derivative of crude oil.
  • There is a strong correlation for a 1 week lag in changes in crude oil being reflected in diesel prices in Australia.
  • In November, crude oil had its worst month in ten years.

Weekly Wool Forwards for week ending 7th December 2018

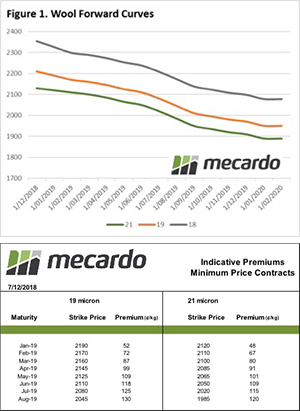
Increased activity noted in the wool futures market this week with seven contracts traded in total through mid and course fiber categories.

The 19 micron fibres had one contract traded for January 2019 for 2160¢.

21 Micron fibres had two contracts traded. 12 December 2018 at 2,125¢ and March 2019 at 2100¢.

28 micron fibres saw two contracts traded for March and April 2019, both at 900¢. Similarly, 30 micron fibres saw two contracts traded for March and April 2019, both at 730¢.

No minimum price contracts or 18 micron futures contracts were traded this week.

Crimea river.

This weekend Russia and Ukraine edged closer to war. Many may recall the short conflict between Russian and Ukraine in 2014 which provided a short rally in pricing. In this analysis, we look at what the impact could be if this conflict was to escalate.

On Sunday a Russian naval vessel opened fire on three Ukrainian vessels, detaining them and causing injury to six sailors. The incident occurred in the Kerch Strait, which is a contested area between the Azov and Black sea (see map).

There is an agreement that both countries will have entry through this strait to access their respective ports on the Azov sea. However, in the past year, there have been concerns from both sides regarding inspections of vessels which have slowed down trade in this area.

In early 2014, Russian back separatists fought against Ukrainian forces which resulted in Crimea being annexed by Russia (see map). This has led to a tense environment with fighting continuing albeit largely forgotten about by the rest of the world, despite estimates of 10,000 being lost in the conflict in recent years.

During the initial period of the 2014 conflict, risk premiums emerged within the agricultural markets. However, when it was realized that supply chains would be largely unaffected the market fell back.

The main ports on the Ukrainian side of the Azov sea are Mariupol and Berdyansk. These ports are mainly used for the export of steel and grain. The drafts at these ports limit the volume which can be exported. The quarterly exports from both ports are shown in Figure 1, with annual exports at 1.1mmt.

It is important to note that that majority of Ukrainian exports are loaded on the black sea, which is not likely to be disrupted by the current tensions. On average the Azov ports load around 8% of Ukrainian wheat exports (Figure 2).

The risk is limited at present, whilst the tension is restricted to the Crimea and the Kerch Strait. However, if there is an escalation of hostilities, the disruption could spread to the black sea ports. It is important to remember how vital Russia and Ukraine are to global wheat exports. In this season it is expected that Russia and Ukraine combined will contribute 30% of the global export task (Figure 3).

What does it mean/next week?:

An escalation to a full-blown conflict is highly unlikely at present and not in the best interests of either country. However, all eyes will be on Putin and Poroshenko in the coming days and weeks.

The international community have expressed concerns with the Russian behaviour, however, it is unknown how much pressure the west can really exert.

In the event of major disruption to the black sea grain trade, there is likely be very strong premiums enter the market, especially considering the reducing global exportable surplus.

Key Points

  • Russian naval vessels attacked and detained three Ukrainian vessels in the Kerch Strait.
  • The ports likely to be impacted at in the Azov sea; Mariupol and Berdyansk.
  • These ports load on average 8% of Ukrainian wheat exports.

Resilience in wool market

Probably the right result this week in the wool market, where after the turbulence of the previous weeks the market had a settled tone to it.

The two volatile aspects were the strengthening Au$ and the crossbred section where significant demand saw this end of the market rally strongly.

The Eastern Market Indicator (EMI) improved marginally by 2 cents or 0.1%, ending the week at 1,860 cents. The Au$ was stronger by almost 1.0%, closing at 0.732 US cents. That put the EMI in US$ terms at 1,361 cents, a gain of 1% or 14 cents (Table 1).

In Fremantle, the market returned a steady result with the Western Market Indicator (WMI) easing 7 cents to end the week at 2009 cents.

Compared to the original roster posted last week, 34,513 of the 36,000 bales intended for sale this week came to the market. The solid market meant growers only passed in 7.6% of bales offered. This resulted in a clearance to the trade for the week of 31,883 bales, 1863 more than last week (Figure 2). When we look back to the 2017 season, for consecutive weeks 15,000 fewer bales have been sold.

The dollar value for the week was $60.9 million, for a combined value of $1.34 billion so far this season.

In the auction weeks since the winter recess, 546,024 bales have been cleared to the trade, 156,886 fewer than the same period last year. The average shortfall cleared to the trade compared to the same time last year continues to grow and now sits at 9,228 bales per week fewer.

This week it was the Crossbred sections time to shine, Melbourne 28 MPG up 10% for the week with reports of 80 to 100 cent rises as buyers scrambled to obtain wool.

Across the board the Merino section held the line in the face of the stronger Au$, however, there was a varying demand observed for poorer styles and wool showing the effects of the drought. The lower NKt and poorer yielding wool is struggling due to the excessive volumes coming through. This is unlikely to change anytime soon.

The week ahead

With just 2 weeks of selling prior to the Christmas break 39,500 bales on offer across the three selling centres on Wednesday and Thursday.

A steady result would bode well for the New Year opening and what will be an interesting balance between a reduced supply and a healthy appetite for wool from processors.