Tag: Opportunities

Mutton still dragging the chain.

With some wild variation in lamb and sheep markets this year it is unusual to see a relatively steady week. But this is how it panned out this week, with relatively steady prices across the east coast indicators. However, delving deeper into state data hints at what may be to come.

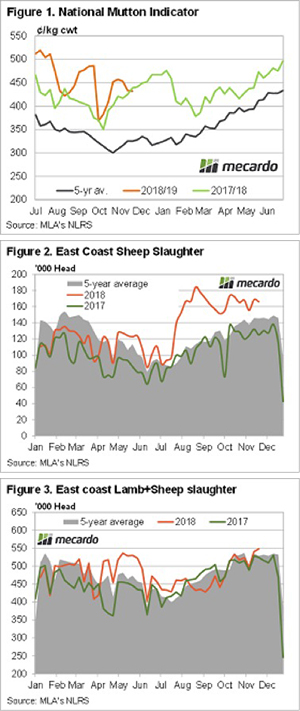
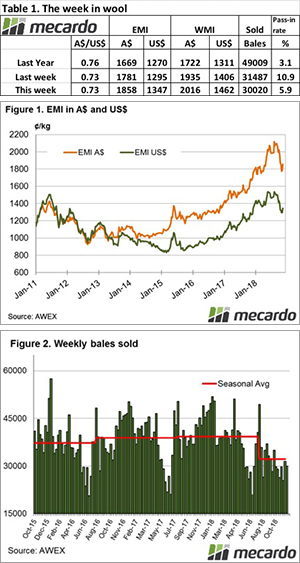
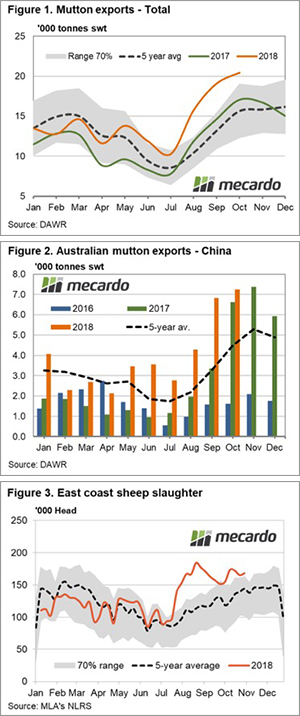
Mutton prices remain well above the five-year average (Figure 1), but this week have again fallen below last year’s levels. With the National Mutton Indicator at 431¢/kg cwt, it was well outstripped by NSW Mutton this week, which sits at 460¢.

Dragging the national average back was Victoria (404¢) and South Australia (336¢). In the West, the Mutton market is close to the national average at 421¢/kg cwt.

Still, Mutton is being slaughtered hand over fist. Figure 2 shows mutton slaughter 33% above the same time last year and 14% above the five-year average. The last time we saw slaughter at this level in the spring was in 2014.

Total Ovine slaughter is shown hitting 548,000 head in Figure 3. It has been four years since the supply of lamb and mutton has been this strong. At that time the Eastern States Trade Lamb Indicator (ESTLI) was at 466¢ and mutton at 295¢. This is a good snapshot of how far demand has come.

The ESTLI finished Thursday at 684¢/kg cwt, supported by NSW where Trade Lambs were 728¢, but dragged lower by all the other states.

What does it mean/next week?:

Rain in NSW this week should continue to help boost demand and should start to limit supply. The flow of mutton has been very strong and we suspect it can’t continue once grass is available. With lamb price still well above last year’s levels, we expect mutton to make up some ground before lamb makes its next move higher.

Geopolitics at the fore.

It’s been an interesting week, with geopolitics front and centre. Early in the week, we had a fracas between Russia and Ukraine and today the leaders of the world meet for G20 talks. In this comment, we look back at the big drivers in the market.

This weekend the leaders of the G20 will meet in Buenos Aires. This could be a very interesting meeting, with the US-China and Russia-Ukraine issues being a considerable talking point. The market has reacted to the potential for positive discussions between Trump and Xi with Soybeans up 3% or 24¢/bu (Figure 1).

The US soybean market has fallen dramatically since China announced tariffs against imports, which in turn resulted in Brazilian exports trading at a strong premium to the US. There are expectations that positive conversations would lead to a relaxation of the current tariff structure.

Chicago wheat futures fell to end the week down 2% or A$8.9/mt (Figure 2). The concerns of distribution to trade flows in the black sea have largely been removed from the market (see Crimea River), as ports in the affected region on export <10% of the Ukrainian crop.

The planted area for the 2019 wheat is expected to be high. Russian winter plantings are expected to reach record levels this season, which although there is a long time until harvesting does point towards the potential for another strong year of production.

Due to the China-US tariff scuffle, soybeans are being held in storage which is becoming a concern for prices during the 2019 season. It is expected that after a 100 year low in wheat planting for last year, we will see a resurgence of wheat acreage.

In the past week, local prices have risen whilst Chicago has dropped, therefore providing an improvement in basis levels (Figure 3). At present, farmers are reluctant sellers, especially with the stop-start harvest that we are currently experiencing.

It is important to remember that these basis levels (or premiums) over Chicago are very strong (see This isn’t the new level). As grower selling starts to increase we may see a decline in premiums, albeit still remaining at historically high levels.

What does it mean/next week?:

If we see a positive meeting between Xi and Trump, we are likely to see a positive impact on markets. There are concerns that continued tariff restrictions between China and the US will have wider economic ramifications, an easing of the tariffs will lead to increased confidence.

Climate woes as cattle price goes sideways

Terrible fires across Queensland and floods impacting coastal NSW are a cause for concern this week and are taking the focus off cattle markets. At least there wasn’t much to keep an eye on, as sale yard prices across the country remained within a handful of cents of last week’s levels.  

Climate has dominated the news media over the last few days with the fires impacting Gracemere and causing the evacuation order to Rockhampton, which is of particular concern for those with an interest in cattle markets. After spending time in Rockhampton this year for Beef Week and enjoying the hospitality of the locals it makes the footage hit home a little harder, so stay safe any Queenslanders facing these unprecedented fire conditions.

The Bureau of Meteorology released their updated climate outlook for the next three months yesterday which highlights a drier and warmer than normal scenario for much of Queensland during Summer, so hopefully this current fire concern isn’t the beginning of a long, hot battle. The December rainfall forecast for much of the country looks reasonably promising with a 50/50 chance of rainfall exceeding median levels across the southern regions – Figure 1.

A glance at sale yard cattle prices along the East coast saw most categories reported by MLA marginally softer by 4-6¢ on last week’s levels. The Eastern Young Cattle Indicator (EYCI) mirroring the broader market with a 4.25¢ decline to close at 523.25¢/kg cwt – Figure 2.

Price stability is also the order of the week for offshore markets with the 90CL Frozen Cow indicator hovering around the 560¢/kg CIF level for the last month – Figure 3.

Next week

Rainfall relief is expected to hit Queensland, but not until mid-week when parts of central Queensland will get up to 50mm. There are also some light falls for southern Victoria which will help sustain pasture a little longer before producers head into the summer.

We are yet to see how the Queensland fires will disrupt cattle markets and prices into next week, if at all. Historically cattle prices during December are relatively stable and the anticipated outlook for December isn’t likely to disrupt the normal flow of events so expect price consolidation to continue for the short term.

Does the forward curve support producers or consumers?

Does the market structure at present offer an opportunity for producers, consumers or both to reduce their price risk for the 2019/20 harvest? In this article, we examine both local and overseas futures to provide some options for hedging.

It is always of great importance to look beyond the current harvest and towards the horizon. This is equally important for both producers and consumers.

The bulk of the wheat price received in Australia is the futures element, with the predominant contract being the Chicago contract (CBOT). In a typical year, basis would account for around 30% of the overall price, in a drought year like present, this will increase substantially.

The forward curve remains in contango, where forward contracts are at a premium to spot. At present, the December 2019 contract is at A$276, a A$22 drop from this time last month (Figure 1). This is clearly less attractive for hedging for growers, however, it does provide a much more attractive opportunity for consumers.

This is the lowest level since mid-July, providing a solid floor to start the procurement process for the 2019/20 season. There is a long way to go between now and next harvest and hiccups in the northern hemisphere could lead to substantial price rises. This is especially true during the northern hemisphere risk period where we have seen strong movements in recent years during the mid-year (Figure 2).

What about for producers? In mid-August, I highlighted the opportunity for producers to hedge using ASX for Jan 2020 (see article) and also how this strategy could be used by consumers (see article) in September. At this time, it was possible to lock in A$380 for January 2020. I know that several producers did follow this strategy and the market has now fallen to A$330 (Figure 3). This provided an effective return of A$50p/t.

The market is clearly not as attractive now for producers as it was a month ago, however, A$330 still provides a reasonable base for hedging. This is still a return higher than in recent years.

I generally opt for a risk mitigation strategy where the marketing process is conducted in chunks. This leaves room to continue to participate in any upside, but also not been completely exposed to a market trending downward. It comes back to the old saying, how do you eat an elephant? One bite at a time.


What does it mean/next week?:

The market is currently offering potential strategies for both producers and consumers to reduce their price risk for the 2019/20 season.

The market is very volatile, with local and international conditions for next year on a potential knife edge. No-one knows where the market will be in >12months time, therefore it is prudent to consider strategies to reduce risk, even if only biting a small chunk.

Key Points

  • December 2019 Chicago futures are down $22 to $276 from this time last month.
  • ASX futures for January 2020 have lost some shine falling A$50 to $330 from highs in September.

Increased yardings, easing prices.

A rebound in lamb yarding levels along the East coast was noted this week as the sales program returns to normal post the Victorian Spring Carnival events. The increased supply is weighing on prices marginally, despite the support offered by some reasonable rain to the Eastern half of Victoria and NSW.

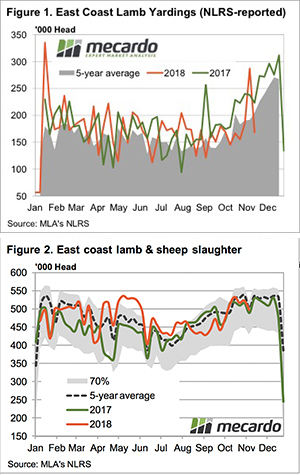
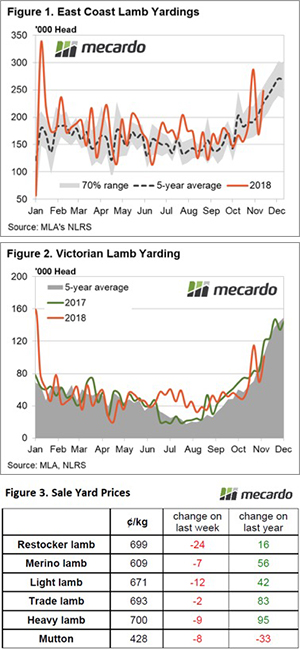
Lamb throughput levels increased 47% on last week’s lull in saleyard offerings, to see it back above the seasonal average by 10% as nearly 250,000 head changed hands (Figure 1). All mainland states contributed to the increase in lamb yarding with NSW lamb throughput levels showing uncharacteristically high volumes for this time in the year, sitting 36% above the five-year average.

South Australian lamb yardings saw a gain of 37% on the week but appear to have reached their spring flush peak a fortnight ago, now sitting 12% under the five-year seasonal average trend. Victorian lamb throughput is back on track for a Spring flush peak during November/December, staging a 46% rebound from last week to see over 101,000 head yarded (Figure 2).

The increased supply of lamb is weighing slightly on prices across the East coast with all NLRS reported categories of lamb registering falls between 2 – 24¢. The Eastern States Trade Lamb Indicator (ESTLI) lost the least ground in the face of the additional lamb numbers, closing yesterday at 693¢/kg cwt (Figure 3).

In the West, trade lambs are continuing to play catch up to the Eastern states prices with a 17¢ increase on the week to close at 641¢/kg cwt. The WATLI managed to climb despite lamb throughput levels running 54% above the seasonal average.

What does it mean/next week?:

With rainfall for the next week mainly confined to Southern Victoria, there isn’t an obvious catalyst to get lamb and sheep prices probing higher. The Victorian spring flush still has a few more weeks to run, so price pressure on lambs is likely to continue to persist into the short term but don’t expect them to drop away too far. Consolidation in price at current levels is probably the most likely scenario over the next few weeks.

Is it a cat or a bull?

Last week we reported the market managed to find a point to stabilise and post a modest rise. It was a different story this week, with a strong market evident from the outset and all categories participating.

Buyers seemed to blink first and they bid up strongly for a smaller offering as recent high pass-in rates seemed to cause concern for mill supply.

The Eastern Market Indicator (EMI) gained a whopping 77 cents or 4.3%, ending the week at 1,858 cents. It has now regained the losses of the past three weeks. The Au$ was marginally softer, closing at 0.725 US cents. That put the EMI in US$ terms at 1,347 cents, a gain of 4% or 52 cents (Table 1).

In Fremantle, the strong demand was also evident with the Western Market Indicator (WMI) rising an impressive 81 cents to end the week at 2016 cents.

Compared to the original roster posted last week, only 31,889 of the 35,000 bales intended for sale this week actually came to the market. The reduced offering producing a stronger market meant growers only passed in 5.9% of bales offered. This resulted in a clearance to the trade for the week of 30,020 bales, 1467 fewer than last week (Figure 2). When we look back to the 2017 season, this week saw 15,000 fewer bales sold, reflecting growers decision to hold wool out while the market was falling as well as reduced supply caused by the drought.

The dollar value for the week was $60.9 million, for a combined value of $1.34 billion so far this season.

In the auction weeks since the winter recess, 514,141 bales have been cleared to the trade, 141,857 fewer than the same period last year. The average shortfall cleared to the trade compared to the same time last year continues to grow and now sits at 8,866 bales per week fewer.

The most impressive moves came in the mid-micron categories, while the carding indicators rose strongly for the second week with increases between 23 cents in Fremantle and 80 cents in Sydney.

The week ahead

The roster for next week shows 36,000 bales on offer across the three selling centres on Wednesday and Thursday. The following weeks are looking at 36,500 and then 40,000 bales.

The question for the market is are we on another “bull run”, or was this week a “dead cat bounce”?

Thanksgiving or thankstaking?

The USA was closed on Thursday for thanksgiving celebrations. This meant that the market was relatively quiet ahead of the holiday, so the focus on this week’s market comment will be on the local market.  

The ASX wheat futures market started the week in the red, as yields surprised, and consumers pulled out of the market. However, on Wednesday afternoon strong trading resulted in the market rising 2% since the previous Friday (figure 1).

The barley market took a turn for the worse this week. On Monday it was announced that China was launching an investigation into allegations of Australia ‘dumping’ barley in an uncompetitive manner. Earlier this year an investigation into US Sorghum dumping led to a 178% bond, this resulted in Australian sorghum becoming more competitive. However, a month later China removed the requirement to pay a bond.

Although prices had been steadily falling since mid-October, the trade reacted strongly to the announcement. This resulted in Barley prices falling across the board (figure 2). Western Australia took the bulk of the hit with prices down 7% week on week and 5% decline in Geelong.

The investigation is expected to last up to 12 months and if a bond is introduced, Australian barley for export will be uncompetitive into China which is overwhelmingly our largest customer.

Prior to thanksgiving volume on Chicago futures tends to dip as traders pull their positions ahead of the holiday. However, what happens when they come back to work? In the past 44 years the market has risen on the first trading day after thanksgiving on 26 occasions (figure 3). Overnight an Egyptian tender was partially filled with US wheat, which will likely give some support for futures when they open.

What does it mean/next week?:

How will the market react as harvest continues? At present it is a Mexican standoff, where buyers hold off and growers store their grain.

There has been strong rainfall in NNSW which will assist with the summer sorghum crop. Although there is still a long way to go until it is harvested, this does provide some confidence.

Precipitating a boost in prices

Cattle slaughter has been on the rise, but it was no match for a rainfall led price rally this week.  Despite this, the Eastern Young Cattle Indicator (EYCI) remains below the same time last year, though there are still some indicators that are beating their 2017 levels.

For the week ending the 16th of November, east coast cattle slaughter ramped up to a five-week high of 139,800 head (Figure 1).  This was driven by the southern states, most notably Victoria, which hit its highest level since May 2016. NSW slaughter was just shy of its highest slaughter level for the year.

In southern states, the cattle are still flowing. With spring coming to an end, it’s not unusual to see rising slaughter, but in Victoria, slaughter was 20% higher than 2017 last week. It seems the herd rebuild might be on hold in Victoria for the time being.

The story is different in Queensland. While cattle slaughter has risen there in the last couple of weeks, it remains similar to this time last year and below the five-year average.

The EYCI had an uptick this week, gaining 11¢ to 527.5¢/kg cwt. Despite higher slaughter rates, the rain across the east coast helped with demand and tightened the supply of store cattle. The EYCI remains 50¢ below the same time last year.

Interestingly, feeder cattle prices sitting around 300¢/kg lwt are close to the same time in 2017.  Despite grain prices being up to 30% higher than last year, the dearth of cattle finished on grass is seeing high grainfed cattle prices continue to support feeder values.

What does it mean/next week?:

There isn’t a lot of rain on the forecast for next week, but the amounts we’ve seen in the last couple of days should be enough to provide continued support for cattle prices. Historically, cattle prices remain steady at this time of year, usually through until Christmas.

However, with higher prices has come higher volatility. We think there is still upside for store cattle but finished cattle values might find a rally a bit harder.

Offshore mutton demand underpins prices despite high supply.

The Department of Agriculture and Water Resources (DAWR) mutton trade figures were released recently for October and showed that offshore consignments continue to run at levels significantly higher than previous seasons. The solid export demand has come at a beneficial time for producers given the higher than normal sheep turnoff experienced from July to November, providing a buffer for domestic mutton prices.

Monthly consignments of mutton exported offshore totalled 20,406 tonnes swt during October, an increase of 7% on the September figures. This places the October result as the highest monthly total on record (our monthly export data goes back to 2000) and is 19% more than we saw during October of 2017 and 31% more than the five-year seasonal average for October (Figure 1).

Fueling the growth in offshore demand for mutton during October has been increased flows to the USA and China. Indeed, since June, average monthly exports of Australian mutton to the USA have been 137% above the five-year average level and Chinese flows have been 82% higher (Figure 2).

During the June to October period, the combined USA and Chinese mutton shipments accounted for about 50% of the flow of mutton out of Australia, so growth in demand from these two destinations is significant.

Abnormally dry conditions this season have seen mutton slaughter running at elevated levels since the middle of the year as producers try to manage stock numbers. As shown in Figure 3, the weekly sheep slaughter levels reported by Meat and Livestock Australia (MLA) show the 2018 trend extending well beyond the upper boundary of the normal seasonal range.

What does it mean/next week?

Normally such an increase to the supply of sheep being turned off would be expected to act as a headwind on price. However, it appears the surging demand out of the USA and China has been a counterweight to the higher supply. Since the start of July 2018, mutton prices have been averaging 11.5% higher than during the 2017 season, despite having 43% higher weekly slaughter volumes than last year.

Key points:

  • The October mutton export volume was the highest monthly total recorded at 20,046 tonnes swt.
  • Since June, average monthly offshore demand for Australian mutton being sent to the USA and China has been well above the five-year seasonal average at 137% and 82%, respectively.
  • Approximately 50% of Australian mutton product exported has gone to the USA or China since June 2018.

Lamb finds a base to bounce off.

The lamb market seems to have found a level it was happy with this week. With supply disruptions due to the Melbourne Cup, it’s hard to get a gauge on supply, but it appears we might have seen the spring low.

The latest yardings reported by Meat and Livestock Australia (MLA) are to the end of last week.  Figure 1 shows that the Melbourne Cup holiday, along with the lower prices, saw a 39.6% decline in yardings. The supply decline saw 119,000 fewer lambs hit the yards across NSW, Victoria and SA.

A quick look at this week’s lamb reports tells us supply has bounced back. Victoria yarded over 100,000 head, which is around normal for this time of year.

Slaughter numbers also tell an interesting story. Figure 2 shows the total sheep and lamb slaughter for the east coast has been close to last year’s levels. Despite stronger prices than last year, processors still seem to be able to make a margin.

Figure 3 shows the Eastern States Trade Lamb Indicator (ESTLI) has again bounced off 680¢ to this week post a 17¢ gain to hit 695¢/kg cwt. There was, however, a decline in prices at Wagga on Thursday, which dragged the ESTLI back from 700¢.

WA Trade lamb and mutton prices managed to maintain their strong levels this week, at 627¢ and 405¢/kg cwt respectively. It’s interesting, however, to see WA restocker lambs back at 554¢/kg cwt.  With cheaper grain in the west, you’d think there should be a narrower spread between restocker and finished lambs than in the east.

What does it mean/next week?:

Growers seem to have shown their cards, with prices under 700¢ now seemingly a hold for many.  It shouldn’t be surprising, with forward contracts close to 800¢ a recent memory.

With more rain forecast for the coming week across parts of NSW and key Victorian and South Australian areas, there might be more sheep and lambs held, and higher prices.