Tag: Opportunities

Prospect of rain brings mixed fortunes

Cattle price movements across eastern states sale yards are a little mixed this week as throughput levels return to seasonal norms and the Bureau of Meteorology (BOM) release their mid-month climate forecast.

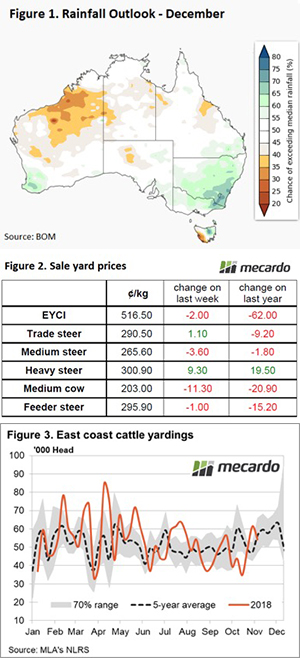
The rainfall outlook for December, released by the BOM yesterday, shows wetter than average conditions anticipated for east/central NSW, eastern Victoria and the southern coastal tip of WA – Figure 1. Additionally, for the first time in many months the remainder of the nation shows that a relatively normal rainfall pattern is expected for the coming month. Despite the improved December outlook, the El Nino watch remains on alert, which suggest around a 70% chance of it occurring into early 2019.

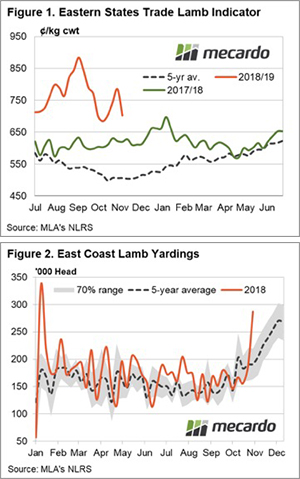
In sale yards across the Eastern seaboard price movements were mixed for the NLRS reported categories. Heavy Steers continue to outperform the herd on a week on week basis demonstrating a 3% lift to close back above 300¢/kg lwt. Eastern Heavy Steers are also the only category to continue to shine on a year on year basis with prices sitting 6.5% above this time last season – Figure 2.

Eastern Trade Steers are the only other cattle type to gain for the week with a small 1.1¢ lift. All other categories are marginally softer, posting falls between 1-3¢, except for Medium Cows that shed 5.5% on the week to close at 203¢/kg lwt.

The Eastern Young Cattle Indicator (EYCI) is holding its ground this week with only a 2¢ decline to close at 516.5¢/kg cwt. Across in the West, young cattle prices are also posting a marginal change, albeit in the opposite direction to the EYCI, with the WYCI recording a 1.75¢ lift to 563.75¢/kg cwt.

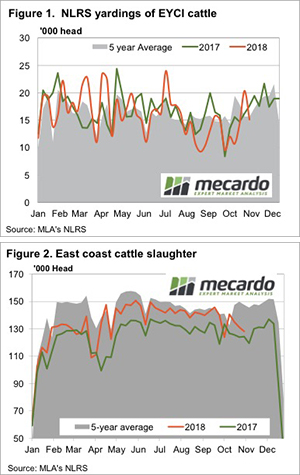
After last week’s slightly elevated cattle yarding levels the throughput on the east coast reverted towards the seasonal five-year average levels with a 12% drop week on week to see the throughput for this week sit at just over 54,000 head – Figure 3.

What does it mean/next week?:

The rainfall forecast for next week, 10-50mm falls are expected for the south eastern quadrant of the country. Eastern Victoria should get the best of the rain, but reasonable falls are anticipated to extend into much of the Eastern half of NSW.

The rain for the coming week and the prospect for a wetter December should provide some support for cattle prices in the next week or two, particularly for finished stock.

Wool market gets a toehold.

Despite this week’s offering being the largest we have seen in a long time, the market managed to find a point to stabilise from the incessant falls. Sydney saw support for the broader microns, Melbourne found strength in the finer microns and mid fibres performed best in Fremantle, resulting in an overall steady week.

The Eastern Market Indicator (EMI) gained just 5 cents, ending the week at 1,781 cents. The Au$ lost some ground, closing at 0.727 US cents. That put the EMI in US$ terms to 1,295 cents, a gain of just 3 cents (Table 1).

In Fremantle, results were fairly mixed with the Western Market Indicator (WMI) rising just 4 cents to end the week at 1935 cents.

Compared to the original roster posted last week, only 35,326 of the 39,883 bales intended for sale this week actually came to the market. Growers appeared more confident in the markets level, passing in 10.9% of bales. This resulted in a clearance to the trade for the week of 31,487 bales, 6,032 fewer than last week (Figure 2). When we look back to the 2017 season, this week saw 36% less bales sold.

The dollar value for the week was $62.05 million, for a combined value of $1.28 billion so far this season.

In the auction weeks since the winter recess, 484,121 bales have been cleared to the trade, 126,565 fewer than the same period last year. The average shortfall cleared to the trade compared to the same time last year continues to grow and now sits at 8,437 bales per week fewer.

It was the crossbred and oddments sectors that provided the market with the real boost. Crossbreds saw gains of 5 to 25 cents, while the carding indicators rose between 70 and 120 cents across the three centres.

The week ahead

The roster for next week shows 35,334 bales on offer across the three selling centres on Wednesday and Thursday. The following weeks are looking at 37,540 and 36,778 bales.

Considering the market managed to cease it’s decline even with one of the largest weekly offerings in recent times, there is optimism for the coming weeks.

Harvest pressure despite minimal receivals

With harvest underway yields are coming in near expected levels.  Looking at receivals gives us a bit of an idea where grain is being stored, and where the top ups are coming from. ASX Futures also suggest a bit of heat is coming out of the market.

Figure 1 paints a pretty stark picture of how yields are faring early in the harvest. With reports that the Northern NSW and Queensland harvests are basically done, just 170,500 tonnes have been received by Graincorp. A third of receivals have been in Victoria.

Compared to the same week in previous years Graincorp receivals have been minuscule. The way things are headed it looks like it will be hard for Graincorp to receive 1mmt this year. Total receivals last year were 5.58mmt.

Bulk handler receivals aren’t necessarily an accurate reflection of the crop size.  We don’t think that the east coast has harvested just 17% of what was harvested to this week in 2017. Most of the grain harvested this year is likely to be stored on farm or delivered direct to consumers.

It’s interesting to note that Graincorp are reporting ‘Transshipments via port’.  We suspect this is grain which has arrived from WA or SA, which is up to 192,000 tonne.  More grain has come in via ship than has been received up country.

Harvest both in the east and west does seem to be putting some pressure on prices.  ASX East Coast Wheat has fallen another $10 this week to $415/t (Figure 2), while ASX Feed Barley is quoted at $383/t.  Chicago Wheat is also close to a six month low in our terms, Dec-18 is back at $252/t in our terms thanks largely to a rising Aussie dollar.

What does it mean/next week?:

Weather is going to be good for harvest in WA over the coming week, while the east coast might see some delays. With harvest and hopes of a summer crop taking some pressure off markets it will be interesting to see what level growers stop selling at. Some support should be found at $400 for wheat, it’s a nice round number.

What in the ag markets changed 254.7% overnight?

Recently there have been releases from both the US Department of Agriculture (USDA) and the National Statistics Bureau (China). There were some very, very big changes to headline numbers.

I have rightly or wrongly always been dubious of supply and demand numbers originating from China. The data reporting does not appear to be as rigorous as other nations and it can be very difficult to obtain a strong handle on what is happening on the ground.

The National Statistics Bureau has revised Chinese corn production from 2007 to 2017 based on census data. This has resulted in large amendments, with production over the period increased by 259mmt (Figure 1). To put this in perspective, China has found 23.6mmt on average over the past decade. Coincidentally, this is the average Australian wheat production for the same period.

The USDA released their November World Agricultural Supply and Demand Estimates (WASDE) overnight. The USDA reflected the change and increased Chinese corn ending stocks by 254.7% between the October and November update. The overall global picture for corn stocks is 307mmt, versus 159mmt one month ago.

If these numbers are truly reflective, then this will reduce China’s need to import corn during this season, or at least until the mandated 10% ethanol in fuel regulation is implemented.

Wheat was also given the bearish treatment, with global end stocks increased by 6.5mmt. This would place world ending stocks at the second highest on record (Figure 2). As ever, we must be cognizant of the fact that 53% of world stocks are held in China and are unlikely to be available to the world market.

The Australian crop was reduced from 18.5mmt to 17.5mmt, which remains above trade estimates. There tends to be a two-month delay in the USDA expressing a change in Australian wheat production from what is happening on the ground. In the December update, it would be unsurprising to see a further reduction to 16.3-16.8mmt. However, this will already be taken into account by the market.

What does it mean/next week?:

As harvest rolls will we get more surprises or will harvest selling pressure bring some downside to pricing?

There is some light rainfall expected for most of the east coast in the next 8 days, which will be positive for the sorghum crop.

Its officially a rout

While AWEX comments on Thursday noted that the market had steadied there is no denying the market again suffered from a lack of buying demand. Reduced offering and falling prices across the board were the end result of what has been a perplexing 6-week period.

The Eastern Market Indicator (EMI) fell 76 cents to accumulate a 200 cent fall over the past 4 weeks, ending the week at 1,776 cents. The Au$ was again stronger up almost 2.1%; the EMI in US$ terms fell by 29 cents to end the week at 1,293 US cents (Table 1).

This puts the US$ EMI back exactly where it was one year ago, and with a dramatically reduced supply year-on-year the conclusion can only be that demand has fallen – at least for the immediate timeframe.

In Fremantle, the Western Market Indicator (WMI) lost ground, falling 74 cents on the back of the last two week’s 89 cents falls to end the week at 1931 cents.

Compared to the original roster posted last week, only 32,000 of the 35,000 bales intended for sale this week actually came to the market. Again, growers were unimpressed with the market and passed in 20.9% or 6,734 bales. This resulted in a clearance to the trade for the week of 25,455 bales, 4,359 fewer than last week.

The dollar value for the week was $48.9 million, for a combined value of $1.22 billion so far this season.

In the auction weeks since the winter recess, 452,634 bales have been cleared to the trade, 109,043 fewer than the same period last year. The average shortfall cleared to the trade compared to the same time last year continues to grow and now sits at 7,788 bales per week fewer.

Of note is that over the past 7 weeks the EMI has fallen 237 cents or 11.7%, while the clearance to the trade has been 82,000 bales fewer than the same period last year.

The only bit of positive news from the market this week was AWEX reporting that on Thursday there was evidence that buyers were reluctant to pass up wool with good specifications resulting in some “resolute bidding” for these types.

Cardings again struggled to find support, with the Melbourne sale noting a further 6.4% fall.

According to the AWEX roster, the next three weeks less than 40,000 per week are predicted, with 39,883 bales next week.

After what looked like a steadier market last week, the opening on Wednesday was again a case of an accelerated decline as buyers waited for the bottom of the market to appear. Again, it would be a brave call to predict a rally next week, the best result would be a cessation of the decline.

East coast lamb yarding levels off like a rocket.

The spring flush is well underway now and the increased numbers at Victorian saleyards this week contributed to an extra 100,000 head of lamb exchanging hands. Although swelling yarding levels weren’t contained to Victoria this week with SA, NSW and WA all posting increased figures.

The impact of the additional supply saw prices ease across the East coast for all NLRS reported categories of lamb. The Eastern States Trade Lamb Indicator took the biggest hit on a ¢/kg basis, with a 33¢ drop to close at 678¢ (Figure 1). Price falls ranged from 12¢ to 30¢ for the remaining lamb categories (Table 1).

East coast lamb yarding levels are up 55% on the week to see 286,762 head reported, well outside the normal seasonal range that could be expected for this time of the year and 49% above the five-year average (Figure 2). The additional lambs across the east coast came from all states, with NSW lamb yardings up 34%, SA up 99% and Victoria increasing 72% from the previous week’s figures.

In the West, lamb yardings were higher too, up 23%. However, the impact on price of the additional supply was restrained as trade lamb prices have been supported by the resumption of the live trade. Mid-week reports for the Western Australian Trade Lamb Indicator saw it gaining 50¢ toward 625¢/kg cwt. As we reported earlier in the week, the spread discount between East coast and West coast trade lamb has narrowed significantly since the return of additional buying competition in Western Australia with RETWA being granted an export license.

East coast mutton prices continue to hold firm, easing a meagre 3¢ on the week to close at 428¢/kg cwt. Mutton prices remain solid despite prolonged levels of sheep slaughter. Indeed, from July to November weekly mutton slaughter rates have been trending 30% higher than the seasonal average but it hasn’t been enough supply to soften prices significantly. Offshore demand is continuing to soak up the excess it appears – stay tuned for an update on mutton exports next week.

What does it mean/next week?:

As our analysis yesterday pointed out, it appears the Victorian spring flush for Bendigo is completed and Ballarat’s numbers are looking to peak soon too. That only really leaves Hamilton as the remaining saleyard to contribute to the final surge of lambs as we head toward the end of the year.

Downside for the ESTLI is probably going to be limited to the 630-650¢ region as outlined in our Mecardo analysis piece from 18th October entitled “A season spent at the edge of normal” and expect a recovery back above 700¢ reasonably quickly after the spring flush subsides.

Waning restocker demand waiting for more rain.

There has been more rain about this week, but it couldn’t stop the Eastern Young Cattle Indicator (EYCI) falling. Young cattle prices are coming off six-month highs, and we thought the Melbourne Cup was supposed to the stop the nation, but it only stopped a few thousand cattle.

Figure 1 shows there was a heavy fall in EYCI yardings this week, with 25% fewer young cattle hitting the yards. It wasn’t all on Tuesday in Victoria. In fact, yardings were down all up the east coast. Prices were also down in most centres, which is strange given the rain, but trade cattle prices were relatively steady.

Perhaps restockers have their fill of cattle for the time being and are holding off while waiting to see if more rain arrives.  The indicators do give the impression restockers cooled off.  The National Restocker Indicator fell 17¢ to 291¢/kg lwt, while feeders were relatively steady, and trade steers eased only 6¢ to 287¢/kg lwt.

Figure 2 gives a good indication why finished cattle prices aren’t falling with store cattle. The supply of slaughter-ready cattle is on the wane, which is unusual for this time of year. The dearth of grassfed cattle, along with cow retention with a bit of rain, has seen east coast cattle slaughter fall to its lowest full week level since March.

Lower Australian supply has seen a rally in export beef prices, they gained 7¢ in our terms this week to 562.5¢/kg swt. The rally was strong in US terms, but improving trade prospects saw the Aussie dollar rally above 72¢.

Next week?:

The cattle market is still waiting for that widespread rain which can sustain a price rise. At the moment restocker supply and demand is waxing and waning, seeing some volatility in the EYCI.  Finished cattle values have been much steadier and are unlikely to ease until there is a good supply of grassfed cattle again.

Bendigo nearly done but spring flush just begun.

We have been talking about Victorian lamb yardings for a couple of weeks now. Firstly, they were lower than normal, then they rapidly picked up last week, to be much higher than normal. We thought it timely to take a look at seasonal supply trends across the major yards, and what this might mean for supply, and price, in the coming weeks.

There is a strange dynamic in lamb markets, where for most of the year NSW contribute most of the east coast yardings, while Victoria has the largest slaughter. In the spring and early summer, Victoria briefly takes the mantle for strongest yardings, pushing east coast levels over 250,000 head.

Figure 1 shows east coast lamb yardings and the impact Victorian yards have during the last two months of the year. During October, lower Victorian yardings saw total east coast yardings track below last year’s levels and the five-year average. The October dearth seems to have been caused by weaker new season lamb supplies at Bendigo and Ballarat. The Ballarat lambs might still be coming, but we suspect the Bendigo lambs were never there.

The Bendigo spring flush is dwarfed when Ballarat and Hamilton get going in November and December. Figure 2 shows Ballarat last week was not far off its peak young lamb supply and the flow is just beginning at Hamilton, with 8000 last week and 11,500 head today.

In November and December 2016, Ballarat and Hamilton yarded 593,000 head of young lambs. In 2017 it was 587,000, which is remarkably consistent, but the seasons were similar in terms of good spring rain.

This year spring has been dry for Western Victoria, not disastrously, but dry enough to see plenty of producers contemplating turning off lambs which traditionally might have been shorn and carried through to the New Year.

We are already seeing a good supply of restocker lambs keeping a lid on prices. Figure 3 shows the National Restocker Lamb Indicator is only marginally ahead of last year, despite the recent very strong finished lamb prices.

What does it mean/next week?:

With a big flush of lambs still to come out of Western Victoria, don’t expect store lamb prices to improve too much before Christmas. We have seen restocker lamb indicators hold well relative to the recent fall in trade and heavy lamb values, and this can be put down to the forward contracts on offer.

However, if supply overcomes demand from restockers over the coming month or six weeks, restocker lambs might well become a hold as the spring flush of lambs ramps up.

Key Points

  • Victorian saleyards have been a bit slow in October, but supply from Hamilton and Ballarat is about to ramp up.
  • Restocker lamb prices are holding relatively firm at last year’s levels but will face supply challenges.
  • If restocker lamb prices fall there might be some tough decisions for those supplying lambs between now and Christmas.

Xie Xie Trump.

Social media continues to be an influencer in markets. In the last day we have seen big moves in the market in response to a tweet made by President Trump regarding China. In this week’s comment, we take a look at the markets it has influenced.

Donald Trump announced (through twitter) positive discussions with his counter part in China, Xi Jinping. During Trump’s election campaign, he had alluded to his desire to change the trade relationship with China. This resulted in the announcement of various tariffs by the US and counter escalations by China.

The biggest impact to the US was with agricultural products, especially soybeans. This resulted in US soybeans becoming uncompetitive versus other origins. This was covered in the article ‘What do US soybeans and the Socceroo’s have in common?’.  The Trump tweet has resulted in expectations that positive trade talks would result in an improvement in soybean exports which have been languishing of late. This resulted in strong rally in soybean prices (figure 1) of 4%.

It is important to note that at this stage, the relationship could easily change direction with little notice. As we have seen, the US president has been volatile at times. It’s not over yet.

Yesterday the A$ rose 1.87% rising from 0.7073 to 0.7205. This was its biggest daily jump since March 2017 (figure 2). The expectations of a thawing relationship between Trump and China, along with a positive Australian trade balance for September which was strongly above expectations.

The increase in the A$ technically makes Australian wheat less competitive from an export point of view, however at present we are well above other origins at present. The stronger dollar will provide some benefits for imported products.

What does it mean/next week?:

Trump could easily change his mind and go stronger against China. This would result in any gains and positive sentiment being lost.

The USDA will released their WASDE report next week, giving an indication of the final results of the season from the northern hemisphere.

This week also saw an increase in US wheat export sales (582.5kmt vs exp 200-500kmt), will we see this repeated for a second week?

The fall steadies but no light in the tunnel.

Wool producers did their best to support the market this week; of the 40k bales rostered only 35,700 were eventually offered for sale with a further 5,900 passed under grower’s reserve. Despite this, the market again fell.

The Eastern Market Indicator (EMI) fell 20 cents on top of the last two week’s 149 cents fall, to end the week at 1,854 cents in AU$. The Au$ rose almost ¾ of a cent; the EMI in US$ terms fell by 5 cents to end the week at 1,322 US cents (Table 1).

In Fremantle, the Western Market Indicator (WMI) lost ground, falling 28 cents on the back of the last two week’s 137 cents falls to end the week at 2005 cents.

Compared to the original roster posted last week, less than 75% of the 40,000 bales intended for sale this week were in fact cleared to the trade. Growers passed in 16.6% or 5,970 of the 35,784 bales that were finally offered for sale. This resulted in a clearance to the trade for the week of 29,814 bales, 3,500 more than last week.

The dollar value for the week was $62.06 million, for a combined value of $1.17 billion so far this season.

In the auction weeks since the winter recess, 427,179 bales have been cleared to the trade, 91,600 fewer than the same period last year. The average shortfall cleared to the trade compared to the same time last year continues to grow and now sits at 7,050 bales per week fewer (Figure 2).

Of note is that over the past 3 weeks the EMI has fallen 169 cents or 8.3%, while the clearance to the trade has been 45,000 bales fewer than the same period last year.

This is a serious correction with the EMI giving back 12% since it peaked mid-August at 2116 cents.

19 MPG and broader types while also easing have been less affected, with 19 MPG and finer not only feeling the brunt of the general market correction, but also the increased volume of drought influenced fine wool has tested buyer’s capacity.

Cardings have plummeted in recent weeks, going from being the “star” performers to now almost unwanted. The Melbourne Carding indicator has fallen from the August peak of 1558 to this week close at 1116, a 28% retracement. Despite the more affordable price, 25.5% of offered Cardings did not reach growers reserve, with only 3,819 of the 5,120 bales offered sold.

The week ahead

According to the AWEX roster, the next three weeks less than 40,000 per week are predicted, with 35,600 bales next week. Growers have decided they are comfortable holding wool so its unlikely this number will get to the auction next week.

While this week the fall was reduced compared to the past two weeks, it is still too early to call the bottom of this recent correction.