Month: May 2019

Mutton leading the charge to new heights

  • The ESTLI is trading 28% higher than this year’s low but is yet to break all-time price highs.
  • The NMI is 47% higher than this season’s low and has pushed above the record high price set in 2016 of 526¢.
  • Seasonal percentage price gain/loss patterns suggest that an ESTLI peak near 900¢ and NMI peak approaching 660¢ this year is not out of the question.

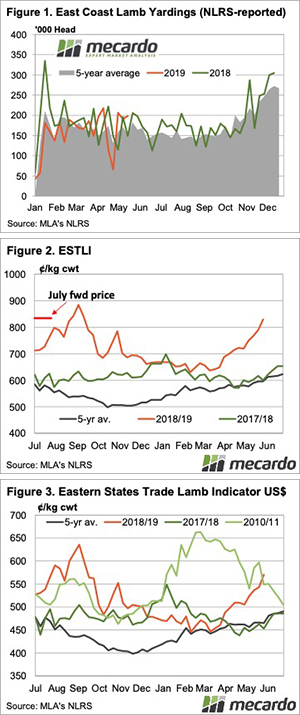
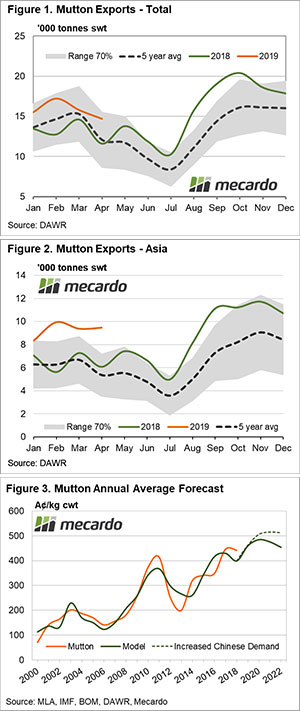
This time of the season we expect to see sheep and lamb prices testing higher and the National Mutton Indicator (NMI) hasn’t disappointed, reaching record heights last week of 544¢/kg cwt. The Eastern States Trade Lamb Indicator (ESTLI) has been pushing northward too but is yet to beat it’s 2018 winter peak of 884¢/kg cwt. What can the historic seasonal pattern tell us about this year’s peak for the NMI and ESTLI?

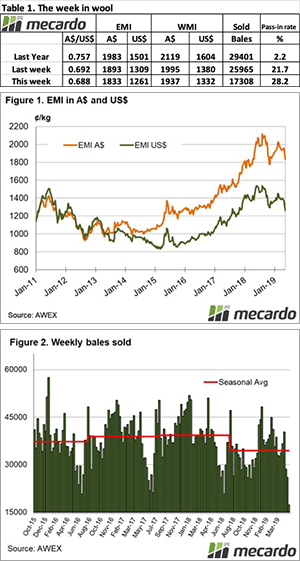
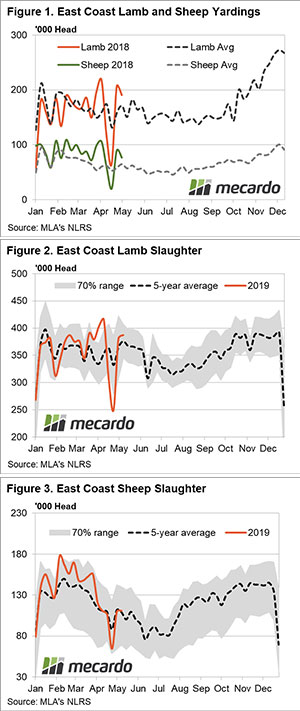
The ESTLI is sitting around 28% higher than the February 2019 seasonal low of 619¢ but is yet to crack the 800¢ level. It’s still nearly 11% short of the winter record peak price of 884¢ achieved last season. In contrast, the NMI has rebounded 47% from the February seasonal low of 369¢ and has well and truly sailed into unchartered territory. After eclipsing the record high of 526¢ set in June 2016 the NMI has pushed toward the 550¢ level in recent weeks (Figure 1).

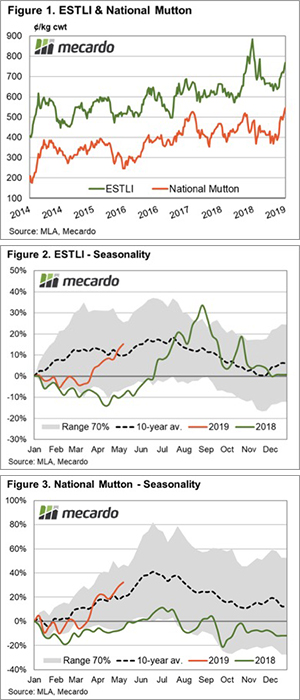
Analysis of the percentage price gain/loss pattern for the ESTLI since the start of 2019 demonstrates that after a similar first quarter trend to the 2018 season, trade lamb prices across the east coast have begun their seasonal price climb earlier than last year (Figure 2).

In 2018 the ESTLI didn’t start to rally until late April/early May but this season we have seen the ESTLI gaining ground since March. The long-term seasonal average pattern for the ESTLI highlights that prices don’t usually peak until late July/early August, so we may have a way to go yet for trade lamb markets. If we assume a winter peak for the ESTLI nearer the upper end of the 70% range, at a 35% gain on the January 2019 opening price, this puts the 2019 peak at 900¢/kg cwt.

The seasonal percentage price gain/loss pattern for the NMI shows that for the 2019 season mutton prices are broadly on track to reach their seasonal peak during June/July (Figure 3). Projecting a relatively normal seasonal trend, as outlined by the ten-year average pattern, shows that a 40% gain on the January 2019 opening price isn’t unrealistic and this would see mutton peaking at around 575¢/kg cwt.

What does it mean/next week?

Interestingly, the continuation of strong export demand for mutton could see the percentage price pattern trend toward the upper boundary of the 70% range. A winter gain closer to 60% from the January 2019 opening price could see the NMI stretching towards 660¢.

Slaughter still running hot as is 90CL.

Cattle markets largely steadied this week, as the yo yo which has been young cattle values stopped to take a look around.  Slaughter rates have been running hot, keeping a lid on prices despite the 90CL hitting a 4 year high.

Just when we thought the heavy supply of cattle in general was on the wane, slaughter rates jumped higher last week.  The 153,569 (figure 1) head of cattle slaughtered last week was the second biggest week for the year.

In NSW and Queensland female slaughter rates remain high, sitting 14% and 16% above the same week last year respectively.  We know high female rates can’t go on forever, and with total slaughter will have to fall at some stage.

Lower prices seems to have had some impact on supply at saleyard level.  Young cattle yardings in Eastern Young Cattle Indicator (EYCI) yards fell by 18%, and this helped push the EYCI 8¢ higher to 468.75¢/kg cwt (figure 2).

With the Aussie dollar falling below 69US¢ this week the 90CL in our terms received a 10¢ boost.  Sitting at 696¢/kg swt, it has been 4 years since the 90CL was this strong.  Strong beef export prices are no doubt helping keep prices reasonable in the face of heavy supply, but will also contribute to a strong rally if and when supply tightens.

The WA Young Cattle Indicator (WYCI) is holding its premium to its East Coast counterpart.  There are better premium in finished cattle market in the west however, with over the hooks rates of 540-580¢ for steer easily beating the 520-530 available ‘over east’.  WA prices are a good indication of what the export market can pay.

What does it mean/next week?:

While some key cattle areas in Victoria and South East SA are going to get some more rain this week, the rest of the country is going to stay dry.  As such we don’t expect any rapid rallies in young cattle prices, but finished grassfed cattle could continue to creep higher.

Wool Week celebrations swing to the buyers

It’s been nice to see the glowing Wool Week campaigns highlighting the benefits of wool to consumers, especially considering the market was far from glowing this week. Prices took another harsh cut, replicating last weeks loss which appears to be driven from uncertainty in the China-US tariff war and added supply coming out of South Africa.

The Eastern Market Indicator (EMI) fell 60 cents on the week to close at 1,833 cents, that’s on the back of last weeks 59 cent loss. The bulk of the drop was on the first day of sale, as some better style wools came forward on day two to slow the downward spiral. The Au$ dropped again to US $0.687 and as a result, the EMI in US$ terms fell by 49 cents to end the week at 1,261 US cents (Table 1).

The Western Market Indicator (WMI) declined by 58 cents to 1,937 cents this week. 48.7% of the small offering of wool was passed in as a result, which AWEX report was the lowest clearance rate in the West since 2003.

It’s times like these when it’s important to keep a check on prices from a historical perspective. There were times last year when we saw the market rally over 125 cents in a single week, and the EMI is still 25% above the five year average.

Nationally, supply was at extremely low levels with the full offering of just 24,121 bales. The total pass in rate for the week was 28.2%, leaving only 17,308 bales cleared to the trade. This is 12,093 bales fewer than the same week last year. In the auction weeks since the winter recess, 1,307,240 bales have been cleared to the trade, 252,308 fewer than the same period last year.

With the joint low volumes and reduced prices, the dollar value for the week was at a very low $32.7 million. The combined value so far this season is $2.991 billion. A simple calculation of $ value divided by bales sold gives us $1,889 per bale across all types for the week.

Crossbred wools took a large tumble in the falling market. The 28 micron fell another 110 cents. In USD terms, in the last two weeks, the 28MPG has retraced 50% of its rise from late 2018. The Merino Cardings Indicators declined 5-40 cents on the week.

High prices yet to fix supply problem

Scomo’s win came as a surprise, but lamb prices streaking through 800¢ was not so much.  The timing is a bit earlier than we expected, it raises some interesting questions as to when prices might ease.

A couple of weeks ago we were talking about what happen when higher prices don’t fix supply issues.  This week the Eastern States Trade Lamb Indicator (ESTLI) gained 40¢ as supply failed to appear, at least direct to works.

Figure 1 shows lamb yardings last week managed to stay at the top of the range.  Strong saleyard values are drawing out anything that is near to ready.  Direct to works supply is no doubt struggling, as rates aren’t competing with those in the yards.  This then forces processors to battle it out at the yards of available supply.  Hence price continue to rise.

Figure 2 shows the pace of the price increase has quickened, but might be due to find a ceiling.  Last year the ESTLI spent just three weeks above 840¢, but there is a little potential for further rises.

In export markets lambs have been more expensive, and for a total of six months.  Last year lambs spent a month higher than current levels in US terms (figure 3).  In 2011 Aussie lamb was more expensive than current levels for five months.

Let’s not forget mutton.  Another week saw another record for mutton values with the East Coast indicator gaining 26¢ to hit 582¢/kg cwt.  With processors now paying over $200 per head for many sheep, it’s hard to see the flock maintaining its current level.

What does it mean/next week?:

While exporters might be able to pass on some of the higher costs of lamb, local butchers are no doubt suffering under the higher prices.  Exports now make up a larger proportion of lamb sales, so local pushback is unlikely to see prices ease.  A widespread rain will make supply even tighter, but it’s not on the forecast, so prices might get a small check at some stage.

Offshore support shores up price

The market is turning around, with overseas concerns starting to be a primary driver on our price (as opposed to drought). In this weeks market comment, we take a look at pricing/basis and the newly launched farm aid package for US farmers.

Since July last year our prices have largely been guided by events locally. The drought has pushed basis (premium/discount over Chicago) to levels unseen during the de-regulated marketing environment. This has meant that broadly prices have been strong, and that events overseas have been mostly inconsequential as drought bites. The story over May has largely changed.

The futures market declined steadily from Mid-October through until the start of May. This was driven by positive prospects for the northern hemisphere crop. The speculators jumped in and became extremely short, driving the market further south.

The US however was hit by rainfall throughout recent weeks which has resulted in delays to the planting of the corn crop. As we are all aware there are relationships between agricultural commodities which has caused a flow on to wheat. In the month of May the December futures contract has risen A$23 (figure 1).

When we look locally at our basis (figure 2), we can see that it has fallen since harvest. The biggest falls have occurred in May when beneficial rainfall hit during the start of the month providing some early confidence to buyers. The increase in futures prices is welcome, and if we see continued dry weather in Australia, basis will likely rise further as buyers return to a state of nervousness.

In the United States, the newest installment of farm aid was launched. The farm aid package is designed to compensate farmers (who happen to be Trumps support base) for losses from the trade kerfuffle between China and the US.

It is not yet clear how the fund will be distributed, but it will be based on a county by county basis. This is in order to ensure that it doesn’t impact upon planting intentions, however there are concerns that it will still increase soybean acreage.

The following statement was made by the US President during a press conference:

“The farmers have been attacked by China, but the $16 billion of funds will make clear that no country has veto on America’s economic and national security” Donald Trump

What does it mean/next week?:

The update on planting progress in the US will be the primary driver of the market in the coming days. If we see corn planting remaining well below expectations, it wouldn’t be surprising to see another rise in levels.

The COT report will also provide an indication of the change in positioning of speculators. It is likely that their net short position will be reduced quite dramatically after recent rises.

Weekly Wool Forwards for week ending 24th May 2019

A quiet week in the forwards market, with 19 micron being the only wool length dealt.

For 19 micron wool, three trades were agreed. One was dealt for June at 2,175¢. For 2020, one trade agreed for both January and February and agreed at 2,070¢ each.

Currently, the forwards prices are higher than current auction prices, which indicates that supply is becoming a concern into Winter and points to the spot auction market making a base at current levels. For this reason, we’re going to hold off on the forward curve while we wait for more data.

Woollen carnage

It’s been quite some time since we’ve seen prices fall so dramatically week on week. From the outset, prices were lower and the falls continued over each day of sale. No micron, style or selling centre was spared.

The Eastern Market Indicator (EMI) fell 59 cents on the week to close at 1,893 cents. When comparing to the record high EMI last August, the current market is 11% lower. The AU$ fell by another 0.5 cents to US $0.691 and as a result, the EMI in US$ terms fell by 52 cents to end the week at 1,309 US cents (Table 1).

The Western Market Indicator (WMI) after losing 31 cents last week, dropped another 67 cents to 1,995 cents this week. AWEX noted the defiance of sellers in WA on Wednesday, where over 48% of the offering was passed in.

Supply was reasonably unchanged on last week, 352 additional bales were offered to take the full offering up to 33,154. But with a whopping 21.7% of wool passed in, a mere 25,965 bales were actually cleared to the trade. The last time we saw pass in rates this high was in October last year when the EMI was at 1,874 cents. Coming off a record EMI in August 2018, growers weren’t happy back then to sell in the falling market. While this weeks market isn’t far from those levels, it’s still a good leg above the season lows in November.

In the auction weeks since the winter recess, 1,289,932 bales have been cleared to the trade, 240,215 fewer than the same period last year. The average shortfall cleared to the trade compared to the same time last year now sits at 6,492 bales per week fewer.

The dollar value for the week was reduced again at $51.83 million for a combined value of $2.959 billion so far this season. A simple calculation of $ value divided by bales sold gives us $1,996 per bale across all types for the week.

Even crossbred wools couldn’t hold their stance in the falling market. The 26 and 28 micron plummeted down 110 – 140 cents in Melbourne. The broader 30 and 32 micron fibres weren’t as heavily discounted, dropping just 20 – 30 cents. The Cardings Indicators fell 35 to 50 cents on the week to the support level of 2015-2018 at around 1040 cents.

Supply still strong, but a tightening looms.

Yarding figures remain elevated for lamb and sheep despite a recent downturn. Lamb slaughter levels are above average too, while sheep slaughter has returned to levels consistent with the five-year average seasonal trend. Perhaps it is a good omen for producers as we approach Winter that prices continue to firm in the face of strong supply.

As reported in last week’s market comment higher prices for lamb and sheep have failed to encourage more throughout at the sale yard with east coast levels for both categories posting a fall from the week prior (Figure 1).

Average weekly east coast lamb yarding levels for May have been running 20% above the five-year average and sheep yarding levels during May have been trending 35% higher than their long term seasonal average pattern indicating that demand for lamb and sheep remain robust as prices have been steadily moving higher.

Indeed, at the Ballarat sale earlier in the week heavy export lambs set a Victorian record price of $300 per head, which equates to around 785¢/kg cwt. Higher prices have been replicated across the east coast with the Eastern States Trade Lamb Indicator (ESTLI) climbing 3% to close the week at 787¢/kg cwt. East coast mutton unable to hold ground this week, but only eased 4¢ to close at 557¢/kg cwt.

What does it mean/next week?

A glance at the five-year average seasonal trend for lamb/sheep yarding and slaughter show a clear decline in volumes as we head toward Winter, so a tightening of supply is looming.

A weakening Australian dollar, down around 3.5% over the last month and trading below 70US¢, combined with robust offshore demand for Aussie lamb/sheep exports should continue to provide solid price support across ovine markets in the coming weeks.

Have wheat imports impacted Australian prices?

This week sees the first permit for the importation of wheat into Australia since 2007. This has caused a great degree of consternation with producers in the eastern states. But has it had any impact on prices?

The import of wheat into Australia has the potential to cause two issues to grain producers:

1. Biosecurity
There is a concern that the importation of grain could bring foreign diseases or pests which are not currently an issue to Australian producers. There is the potential for large losses to production caused by these pests.

2. Economic
At times there will be the potential to import grain from overseas cheaper than buying domestically, especially in times of drought. Hypothetically the importation of overseas grain would place a ceiling on the domestic price of grain.

At present, the numbers don’t stack up for imports into Australia from any other origins, due to the post-harvest fall in pricing and cheaper options from Western Australia. Nonetheless, this permit approval potentially sets a precedent for future import programs in the event of a drought.

In figure 1, the futures prices for ASX (Jan 2020) and CBOT (Dec 2019) is shown, as we can see prices have risen in both contracts.

The rise in Australia is mirroring the rise in the US, as they struggle to plant their crop due to the recent rains they have experienced. Although prices have risen in Australia, it is not due to the vessel.

The impact of wheat imports of this scale (and time) are negligible from a pricing point of view.

What does it mean/next week?:

The single vessel import permit for Manildra will have limited impact upon the market in its current form. However, if future perpetual permits were issued there is a likelihood of import parity becoming a more realistic issue in times of drought.

In an average year, importation will not be a feasible enterprise for grain consumers.

Asian appetite for mutton holds firm

  • Total mutton trade volumes for April are sitting 21% above the five-year trend.
  • Consignments to Asia are 76% above the April five-year seasonal average level, buoyed by Chinese demand which is running 96% higher than the five-year trend for the January to April period.
  • Mutton price modelling shows that continued growth in Chinese middle-class wealth could negate the impact of increased slaughter in the coming years, keeping mutton prices firm.

Department of Agriculture and Water Resources (DAWR) trade statistics for April were recently released, revealing that the above average flow of mutton product leaving Australia persists. Analysis of the key trade destinations highlights that Asian demand continues to underpin the total mutton consignments. This piece reviews the impact on mutton prices over the next few years if the Asian demand continues to grow in line with an expanding Chinese middle class.

Total mutton exports for April recorded the lowest monthly volume for the current season at 14,675 tonnes swt, a 7% decline on the March figures. Despite the lower trend, mutton exports have remained above the five-year average seasonal pattern during 2019 and the April volumes are comfortably sitting 21% above the five-year average for April (Figure 1).

The 2019 trend for total mutton exports has spent the season in the upper end of the normal range, as identified by the 70% shaded zone. In contrast, mutton exports to Asia have started 2019 incredibly strongly, remaining above the normal range and around 50% higher than the five-year average monthly trend for the January to April period.

It is not uncommon to see Asian mutton demand begin to wane as we head into April. However, this season it has remained firm with 9,640 tonnes shipped, 76% above the five-year April average pattern (Figure 2). Chinese demand for mutton has been a key driver of the elevated Asian volumes. Average monthly flows of Australian mutton to China for the January to April period were 96% above the five-year trend.

An anticipated reduction in mutton slaughter levels to 7.2 million head in 2020 could see average annual mutton prices peaking around 485¢, before an increase in mutton slaughter during the 2021 and 2022 seasons pressures annual average mutton prices back down to the 450¢ region (Figure 3). However, growing Chinese demand for mutton could negate the impact of increased slaughter into the 2021 and 2022 seasons, pushing the annual average mutton price above 500¢.

What does it mean?

Mutton price forecast modelling undertaken by Mecardo highlights a link between the growth in Chinese wealth levels and the increasing consumption of mutton. Figure 3 also demonstrates the forecast price impact upon the Australian mutton price. It assumes an increase of Chinese per capita GDP from $US9,776 in 2018 to $US13,000 by 2022 and annual trade volumes of mutton from Australia to China growing by 25% over the 2019-2022 period.