Month: May 2019

Weekly Wool Forwards for week ending 18th May 2019

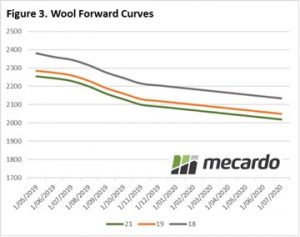
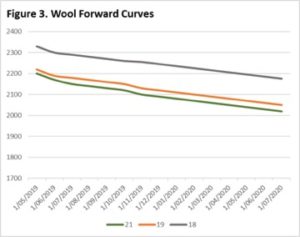
A solid week in the amount of forwards trades this week, especially for crossbreds which were collateral damage in this weeks’ auction market falls. Bets are on to see if prices continue to drop or level out again so it’ll be interesting to see developments in the coming weeks.

For 19 micron wool, one trade was dealt for June and agreed at 2,185¢. In 21 micron, two trades were dealt, one for June at 2,170¢ and one for August at 2,130¢.

In course fibers, four trades were dealt for 28 micron, two in June, agreeing at 1,100¢ & 1,200¢; one for January 2020 at 1,020¢ and one for August 2020 agreed at 1,000¢.

Young cattle demand dries up, again

A fortnight ago we were talking about the Eastern Young Cattle Indicator (EYCI) yo yo going up.  This week the yo yo went down, with young cattle prices falling back towards April lows.  When looking for a culprit, it would seem a return to dry conditions might be to blame.

Figure 1 shows the EYCI only managed to spend one week above last year’s levels, before tanking heavily this week.  The 8% drop took the EYCI back to 460¢/kg cwt.  The fall in young cattle prices was widespread, with the big movers being Inverell, Gunnedah and Scone, which all lost around 70¢.

The biggest yard in the EYCI, the Roma store sale, lost 25¢, falling to 481¢/kg cwt, so it maintains a premium to the EYCI itself.

With yardings relatively steady for the week, it would seem demand was to blame for falling young cattle prices.  Restocker Steer Indicators saw the largest falls, while trade steers also lost some value.  Feeder cattle were largely steady, suggesting demand for heavier young cattle remains strong.

Heavy Steer demand was definitely not on the wane.  Figure 2 shows the NSW Heavy Steer Indicator rallied a further 37¢, moving to 526¢/kg cwt.  In Victoria and NSW Heavy Steers maintained their value, and are now back at close to record premiums to the EYCI.

The dry autumn in WA came to impact markets this week.  The Western Young Cattle Indicator fell 42¢ this week to 505¢/kg cwt, but it remains at a premium to its east coast counterpart.

 The Aussie dollar lost more ground this week, finishing close to 69 US¢, and pushing the 90CL Indicator back up to 689¢/kg swt.  The 90CL is now a full 100¢ above the same time last year.

What does it mean/next week?:

Key cattle areas aren’t going to receive much rain this week.  There will be a bit in south west WA which might help there, and parts of SA will get some more, but it is unlikely to be enough to see young cattle prices rally.  It’s hard to see finished cattle prices falling however, with supply unlikely to improve until the spring.

What happens when you just add water?

Fifty millimeters were tipped out of the gauge this morning in the Western districts of Victoria, where I live. Gladly, the weekly rainfall pattern shows that much of the south east quadrant of the nation have been doing the same with 25-50 mm fall registered in many regions, bringing some support to cattle prices.

Figure 1 highlights the extent of the recent rainfall with large areas of NSW, southern Queensland and eastern Victoria benefiting. It hasn’t stopped raining across the western half of Victoria overnight and the Bureau forecast is for rain to continue here across the weekend.

East coast cattle yarding levels have returned to normal, after the wild swings seen during the April market disruptions and the seasonal five-year trend shows weekly levels tend to contract throughout May/June from 60,000 head to 45,000 head as we head toward winter – Figure 2.

The recent rains are going to encourage tighter supply and we should begin to see the impact on throughput and price in the coming weeks. The Eastern Young Cattle Indicator (EYCI) gained 2.3% on the week to finish 0.25¢ short of 500¢/kg cwt. In the west, young cattle prices eased, yet remain at a premium to the east coast with the WYCI closing the week at 522.75¢ – Figure 3.

The 90CL indicator eased slightly to dip back below 690¢, after holding above here since mid-April. The significant premium of the 90CL to the EYCI allowing plenty of upside to local prices should the rain continue into winter and cattle supply tighten.

Next week

The rainfall forecast for the week ahead shows falls are anticipated across the entire eastern half of the country, although the heaviest falls are reserved for east-central Queensland and western Victoria. NSW, the state most in need, is going to be lucky to get more than 5-10mm. In the western half of the country there is barely a drop on the short-term horizon.

Given the mixed rainfall pattern national cattle prices are more likely to trend sideways over the coming week unless the traditional winter tightening of supply sets in early.

Not raining grass but restockers banking on it

It has been some time since we’ve talked about rainfall driving sheep markets for three weeks in a row. Precipitation has all but completed the autumn break for key sheep areas in Victoria and South East SA. It doesn’t rain grass, but try telling restockers that this week.

In another week of stronger prices, it was restocker lambs which stood out in the ovine complex.  Figure 1 shows the NSW Restocker Lamb Indicator streaking ahead of the Eastern States Trade Lamb Indicator (ESTLI).

The NSW Restocker lamb price has gained over 100¢ in two weeks, and 250¢ in six. For a 16kg cwt lamb this equates to $16 and $40 per head, with prices this week at $136 per head. Figure 1 shows 854¢ is a new record, well above the peak seen in September last year.

Those buying restocker lambs in NSW are literally banking on grass growing. If finished on grass, lambs bought now and sold at better than 800¢ should make a good margin.

Mutton prices set another record this week on the east coast hitting 561¢/kg cwt.  In WA, sheep are not cheap, but at 400¢, they are a long way behind the east. Trade Lambs are not as far behind, the WA indicator at 703¢ (Figure 2), less than 10% behind the ESTLI.

Over the hooks prices moved higher this week in response to rising saleyard values, with NSW leading the charge. The rain in Victoria this week is likely to see southern prices catch up.

 Next week?:

When rising prices don’t draw out more numbers, prices generally keep rising. Last year the rally lasted five months and finished 55% higher than the autumn low. The next leg up might be soon and sharp. Rain in Victoria might encourage holding of lambs for winter premiums, so it might take another 40¢-50¢ higher to draw them out.

Export volumes down but value up

The wool market tracked lower for Merino types this past week however crossbreds bucked the trend and continued to rally.

As for exports, Chris Wilcox, NCWSBA, reports that export volume is down 12% for the season to March, however as a reflection of the strong market export value is up by 3%.

Chinese activity was even more effected, with season to date exports down 17% and export value down by 1%. This could be viewed as a concern; our major customer taking less wool, or it could be viewed as a positive; other markets stepping in to spread the demand.

The Eastern Market Indicator (EMI) eased by 8 cents on the week to close at 1,952 cents. The US$ fell by almost 0.5 cents to US $0.697 and as a result, the EMI in US$ terms fell by 15 cents to end the week at 1,361 US cents (Table 1).

The Western Market Indicator (WMI) after gaining 28 cents last week, gave up 31 cents to 2,062 cents this week.

It was a much reduced offering of 32,801 bales that came forward this week. Growers passed in 12.9% of the offering. The break up was 9% in Sydney, 12.9% in Melbourne while Fremantle sellers passed in 18.1% of bales offered.

This meant 28,576 bales were cleared to the trade, almost 12,000 fewewr than last week. In the auction weeks since the winter recess, 1,263,967 bales have been cleared to the trade, 230,624 fewer than the same period last year. The average shortfall cleared to the trade compared to the same time last year now sits at 6,406 bales per week fewer.

The dollar value for the week was $58.3 million ($82.9 million last week) for a combined value of $2.907 billion so far this season. A simple calculation of $ value divided by bales sold gives us $2,039 per bale across all types for the week.

The only positive moves were for the Crossbreds, gaining another 10/15 cents but mainly confined to the 28 micron and finer. While Cardings in Melbourne & Sydney were largely unchanged, however Fremantle fell 25 cents.

The week ahead

The roster for the next few weeks is beginning to show the threatened decline in supply. Next week just 33,361 bales are rostered for sale with all centres selling on Wednesday and Thursday. The following weeks 30,719 & 33,360 bales are currently forecast.

Do we have a break?

The rain is falling, and prices are being dragged down in sync. In this update we take a look at the impact on ASX pricing and provide a short case study of a producer utilizing the contract to increase their pricing for the 2019/20 harvest.

It’s good to hear the rain on the roof this morning, helping provide some surety to local growers in Victoria. In the past week we have seen beneficial falls in large parts of NSW and Victoria, which although will not guarantee a crop, it does give some breathing room.

In April, domestic consumers, especially buyers, were concerned about the lack of rainfall, and were buying ASX contracts in order to protect from a second year of drought. This caused a spike in prices up to A$340, the rainfall has removed that imperative.

Since just before the rain the market has fallen to A$304, and with today’s falls has a reasonable change of dropping below A$300.

In figure 1, CBOT for Dec’19 is displayed alongside ASX for Jan’20. Prices have fallen considerably for both markets since the 3rd quarter of last year. The positive outlook for the world production and political issues have pressured pricing and low levels are likely to persist.

The Food and Agriculture Organization released updated production forecasts this week, which are generally bearish. They expect world production to increase by 5% to 767mmt, causing ending stocks to rise approximately 10mmt to 27mmt.

We have been warning that the premium between CBOT and ASX would erode if rainfall arrived and the market moves back to an export focus. We proposed in September that taking some futures cover at levels >A$365 had a high likelihood of providing a financial benefit.

I discussed with a grower this week who utilized this strategy. They sold wheat at A$370, believing it to be a strong price historically, especially so far from the point of physical delivery. They have now calculated that if they closed their futures position that approximately A$20p/t will be added to their overall grain price.

This makes a good case for the benefits of utilizing derivatives as part of a wider grain price risk management strategy.


What does it mean/next week?:

For many consumers the ASX now provides attractive buying opportunities, however I expect many will have reached the limits of their capacity and risk policies.

The WASDE is released overnight – will it provide any surprises?

The weight of the rain

The market was always going to react when the rain arrived. There are many who started their 2019 marketing strategy in the middle of last year. In this update we take a look at physical pricing and basis for new crop around the country.

At its most basic, wheat prices are based on supply and demand, with supply being the most important part of the equation. When there is a sudden shock to supply such as a drought, prices move sharply upwards. The reverse happens when beneficial rainfall arrives, and we see prices fall. This is due to buyers having more confidence that supplies will be available.

In last weeks market comment (see here) and podcast (see here), I mentioned that ASX had fallen 7%. This is a significant fall, and it is under further pressure today with buyers being reluctant to raise bids.

The ASX is a good barometer of grain prices on the east coast. It is important to remember that there is still a basis element between the futures and physical even though it is Australian based.

We are now at the point of the year where physical new crop bids are easily accessible, therefore many farmers who don’t utilize derivatives will be using physical contracts to reduce price risk.

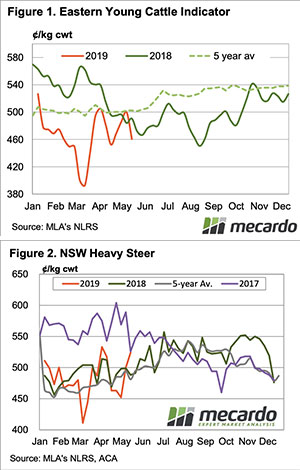
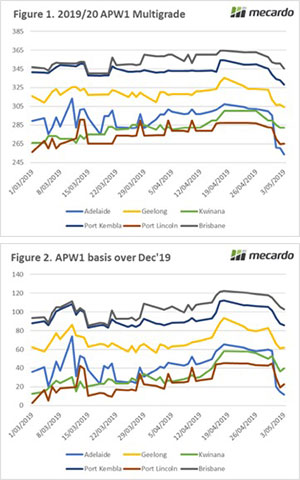
Figure 1 displays the physical contract price for APW1 multigrade and Figure 2 shows the basis versus December Chicago futures. I have selected a number of ports to give a broad spread of the nations’ wheat growing area.

As we can see, the domestic dominated areas have the highest pricing levels. This is due to concerns related to tight stocks in these areas coming into the new season. All zones have experienced dramatic falls since the middle of April when new crop concerns were at their peak.

The rest of the world has seen wheat prices slump as production in the key northern hemisphere growing areas continues to impress. This has meant that our basis over Chicago futures has come under pressure, albeit remaining at traditionally strong levels in the east.

What does it mean/next week?:

It is still very early in the season and rainfall will be the primary driver for Australian basis over the coming months. If we receive plentiful rains, then basis will fall further. Conversely a dry spell will see basis increase in a flash.

Weekly Wool Forwards for week ending 10TH May 2019

A busy week on the forwards market, the first in quite a while, with 14 trades agreed. The lions share of the market has leant heavily into medium fibers, where 9 trades for 19 micron were agreed, most looking far into the future.

In the fine fibers, one trade was agreed for 18 micron in June for 2,340¢.

For 19 micron wool, one trade was dealt for July at 2,245¢. For 2020, two trades were agreed for July at 2,150¢, one for October at 2,155¢ and one for November at 2,125¢. For 2021, one trade was dealt for January, March, April and June, all agreeing at 2,155¢, a true testament to the flat forward curve.  In 21 micron, one trade was dealt for June at 2,250¢.

In course fibers, one trade was dealt for 28 micron in June, agreeing at 1,250¢ and one for February 2021 at 935. One trade was dealt for 30 micron in August for 900¢.

A bit of rain and it all turns green

The title of this commentary isn’t referring to the grass but the sale yard price board for lamb and sheep across the east coast. Although, if we keep seeing rain falling in all the right places it won’t be long before the pasture starts to green up as well.

This week finally saw some decent rain to large parts of Western Victoria and Western NSW with falls extending beyond 50mm in some areas – Figure 1. A welcome relief to those that have seeded crops but also bringing optimism to sheep producers hoping to get some pasture growth before the winter chill sets in earnest.

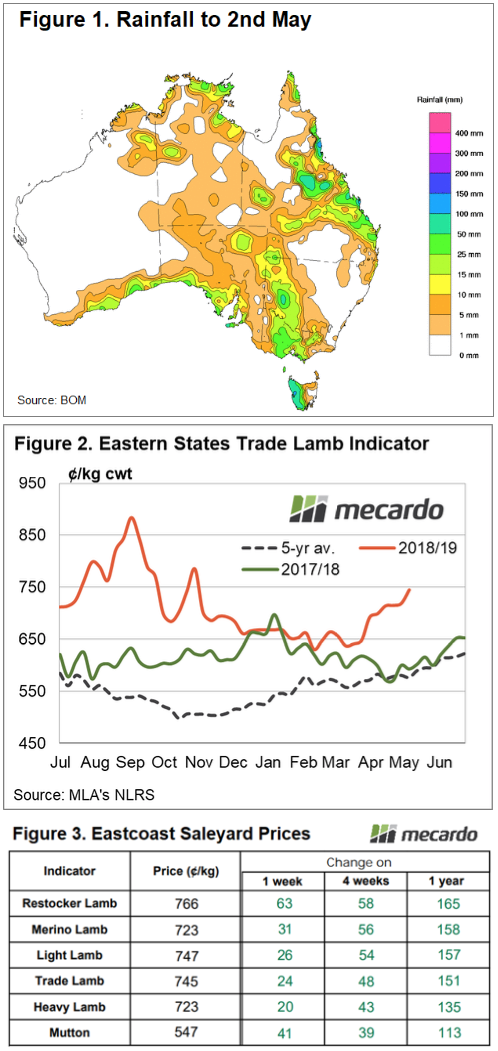
The Eastern States Trade Lamb Indicator (ESTLI) responding as expected to the improved climatic conditions with a 24¢ rally on pre ANZAC day prices from last week to close at 745¢/kg cwt yesterday. Expectations of tight lamb supplies as we head into winter has seen the ESTLI push higher earlier than last season and now sits over 150¢ higher than at this time during 2018 – Figure 2.

As outlined in this week’s analysis the concerns over tight winter supply has seen Coles issue forward prices for July at 830¢/kg which bodes well for producers with supply to offer over the colder months.

The onset of rain lifted prices for sheep and lamb categories across the eastern seaboard, with all NLRS reported east coast categories recording gains this week between 20-65¢, Figure 3. East coast mutton responding particularly well to the wet, recording an 8% lift on the week to see it testing all-time highs to close at 547¢/kg cwt yesterday – it wasn’t that many years ago that lamb producers would have been ecstatic to be getting prices near the 550¢ level.

What does it mean/next week?:

The forecast for rain into the week ahead shows lighter falls expected for Western Victoria and Western NSW with the rain band moving across to the eastern regions of both states. The sales program has returned to normal after the ANZAC and Easter disruptions, so we will get a clear picture of how late Autumn supply is stacking up in the coming weeks.

While the rain persists and as supply starts to dwindle lamb and sheep prices will continue their march northward. Despite the recent heroics of an unnamed Game of Thrones character, kept vague so as not to be accused of spoiling plot lines, “winter is coming”.

Committed to the bear (for now)

Speculation tends to get a bad rap, however, it provides the liquidity to ensure that grain markets operate correctly. 

The commitment of traders (COT) report is a weekly report produced by the US Commodity Futures Trading Commission. The report is released every Friday and is based on the closing position of traders on the close of trade on Tuesday.

The purpose of the report is to provide an insight into the sentiment of the market and where different market participants are trading. When using a futures contract, it is either a long (buy) or short (sell) position.

In the COT report, trader’s positions for contracts are compiled and the area of most interest is where the overall position of speculators lie. The simplest explanation of how to interpret the positions is below:

• If the speculators in the market are net long, then they are bullish and are hoping to capitalise on a rising market.
• If the speculators in the market are net short, then they are bearish and are hoping to capitalise on a falling market.

We all know that speculators bring a huge volume of liquidity into the market and for better or worse they provide the ability to easily trade in and out of positions.

The current position for managed money (or speculators) is shown in Figure 1. This represents the combined position of Chicago, Kansas and Minneapolis wheat. The combined managed money short by 134234 contracts. This means that managed money is currently bearish on the market.

As we can see this bearish slide started in January and has been almost relentless, as global crops started to look promising. It is important to examine the seasonality of the sentiment, which is shown in figure 2.
In this chart, we can see that the current sentiment is extremely bearish compared to typically experienced at this point of the year. It is clear that seasonally the middle of the year is where the speculative money turns bullish. This tends to occur as any crop concerns start to develop.

What does it mean?:

At present, the speculators in the market are very short. However, if we see the release of bullish data, their sentiment can change rapidly.

With the advent of algorithmic trading, it is possible that there can be overcorrections where the market makes substantial movements as traders attempt to close their positions to curb their losses.