Category: Lamb

Where are the Victorian lambs?

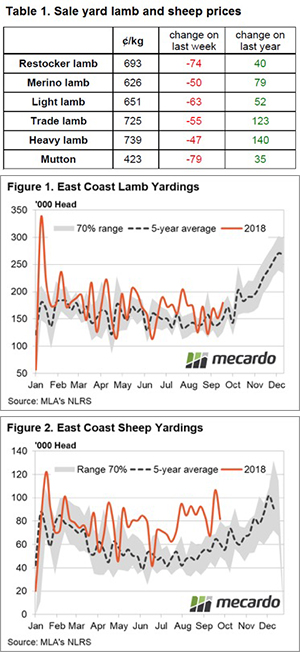
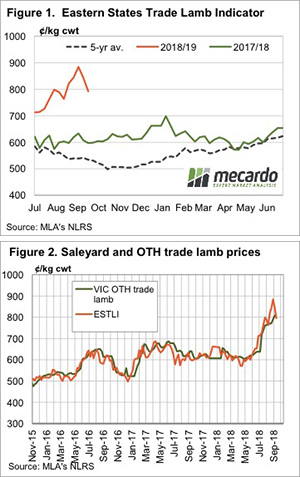
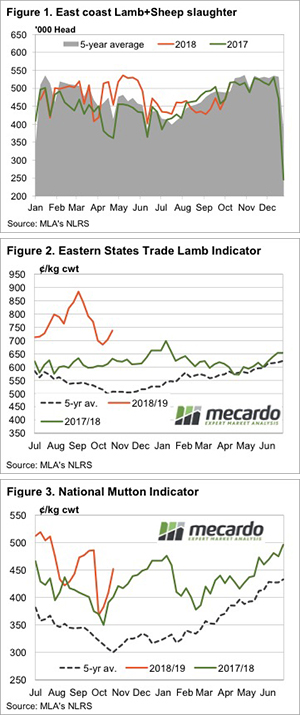
Reduced lamb throughput across all states this week saw prices rise across the board for sheep and lamb markets. The Eastern States Trade Lamb Indicator (ESTLI) demonstrated the apparent supply shortage with a 51¢ gain to see it close yesterday at 788¢/kg cwt.

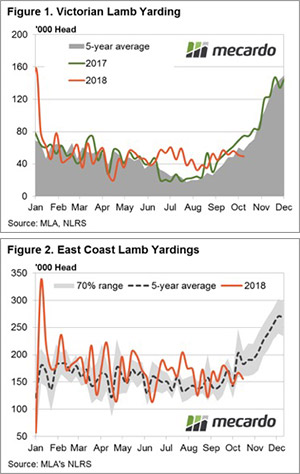
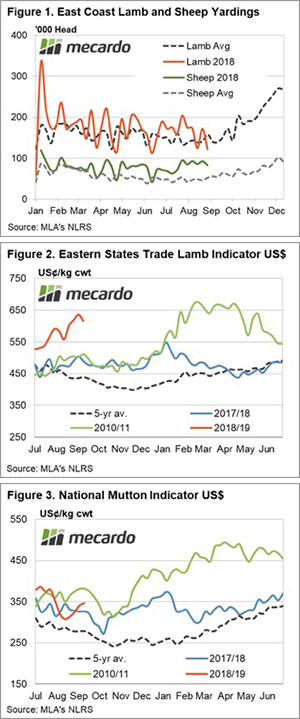
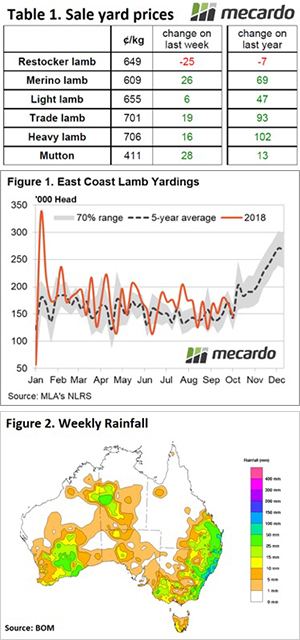
The biggest drop in lamb yardings was reserved for South Australia, with a 24% decline noted in saleyard numbers this week, but all states posted a fall. The curious situation is the flat line of Victorian lamb throughput this week. This is the time in the season when numbers should normally be starting to swell (Figure 1). Victorian lamb yarding levels are running 13% below the seasonal five-year average for this time in the year and at 49,302 head, it’s a whopping 34% lower than the same time last season.

The reduced supply of lamb across the Eastern seaboard is having an impact on east coast throughput with the trend dipping back below the lower end of the normal range for the first time in over four months (Figure 2). East coast lamb yarding levels are trekking 15% below seasonal average levels and the lack of supply is evident in price activity this week.

The NLRS reported eastern states daily indicators posted price gains across all categories of lamb ranging between 25-85¢, with Heavy Lamb managing to break back above the 800¢ level to close at 825¢/kg cwt. Even east coast mutton managed to lift 14¢ on the week to close at 466¢, that’s despite sheep yarding levels on the east coast remaining elevated. Indeed, east coast mutton throughput is running 48% above the five-year average for this time in the season with NSW and Victorian saleyards the key contributors to the additional supply.

What does it mean/next week?:

The Bureau of Meteorology released their updated rainfall outlook yesterday and it paints a dire picture for November with most of the country expected to have a drier than normal end to spring (Figure 3).

If this isn’t enough to shake out any remaining lambs in the next few weeks then I’m not sure what will. Expect to see Victorian lamb yarding levels start to swell in the coming month and this is likely to put a cap on further price gains in the ESTLI for the short term.

Rising supply but demand is matching.

Sheep and lamb slaughter has been on the rise, but so have prices. Both lamb and mutton values rallied this week with significant rain falling just as processors seem to be increasing kills and looking for stock. The question is how much further prices can go?

Meat and Livestock Australia’s (MLA) weekly slaughter data is a week old but it tells an interesting story. Lamb slaughter was down 11% on the same week last year, but sheep slaughter was up 27%.  The total sheep and lamb slaughter, shown in Figure 1, was almost exactly the same as the same time last year.

It appears the kill space is opening up again as supply improves, and there might be some money in sheep and lambs for processors again, as they are pushing prices higher.

The Eastern States Trade Lamb Indicator (ESTLI) gained 36¢ this week, rallying back to 737¢/kg cwt.  Heavy lambs are still the highest price, at 742¢.

Figure 3 shows Mutton values regaining much of the fall seen in early October. While lamb prices have never been higher, apart from recent times, mutton values were indeed stronger in December last year. This suggests mutton might have a bit further to go.

Restocker lambs had the biggest move this week, gaining 90¢ to move to 739¢. There are perhaps some restockers anticipating the rain seen this week will result in some good pasture growth in what’s left of spring.

What does it mean/next week?:

With increasing confidence and renewed restocker demand, it’s hard to see sheep prices falling.  Lamb prices might have a blip or two left in them when Victoria’s supply appears in November.  Recent forward contracts suggest we might have already seen the low, however.

Forward contracts breaking with tradition

With rising concerns surrounding the supply of finished lambs during the summer, export processors have released forward contracts. We say the forward contracts are breaking with tradition because they are pegged well above the prices of the same time last year, which they no doubt had to be if they wanted to get any traction.

The widely published forward contracts came from Thomas Foods International (TFI) who released the same prices for their Tamworth and Lobethal plants, for delivery from the start of December to the end of February.  TFI priced both crossbred and Merino lambs at levels well above the summer of 16-17, but below the recent peaks of September.

TFI’s December price for crossbreds was 750¢, rising to 780¢ in January and 800¢/kg cwt in February.  Merino lambs are 30¢ behind, and all are for 18-32kg cwt lambs.  These are extraordinary levels for lambs and will be a boon for those who can finish lambs on green feed.  For those who have to feed grain to lambs, the forward prices should be profitable, and hence this is part of the reason they are pitched there.

Over the last few years lamb forward contracts have been available for the summer, and are generally released at this time of year, and pitched close to the levels of the previous year.   The thinking is that prices are usually low in spring, and forwards around last year’s prices are generally acceptable to producers.

This year pricing forwards even at 700¢ would be unlikely to get much take up.  With spring prices sitting around 700¢, and prices over 850¢ a recent memory, few producers would be willing to accept a 650-700¢ forward price.

Figure 1 shows where the crossbred forward prices sit relative to last year, the five year average, and recent prices.  They are 12 and 28% above last year’s Eastern States Trade Lamb Indicator (ESTLI) depending on when you are selling.

Figure 2 shows the same chart but for Merino lambs.  The National Merino Lamb Indicator (NMLI) has never been above the 770¢ on offer in February.  Merino contract prices are between 19 and 35% above last year, and look like even better value.

What does it mean/next week?:

If producers are confident they’ll have lambs for delivery in the December to January period, why wouldn’t they take up forward contracts for at least some of their supply?  For it to be a costly mistake, lamb prices will have to be consistently over 800¢ throughout the summer.

While its likely lambs will get over 800¢ at some stage, having the price and delivery locked in means there will be no hanging out for better values.  For Merino lambs selling forward should be seriously considered, as higher prices are even rarer.

With forward contracts for many weeks now booked up at TFI, producers seem to have been happy to get on board and lock prices in.

Key Points

  • Lamb forward contract for summer have been released.
  • December price for crossbreds was 750¢
  • Merino lambs are 30¢ behind

Supply and price respond to rain.

Lamb and sheep markets along the east coast were provided with a price boost this week as some welcome rainfall saw lamb throughput ease. The Eastern States Trade Lamb Indicator (ESTLI) climbed 3% to creep back above 700¢/kg cwt.

Price gains across the eastern seaboard were not just limited to the Trade Lamb categories. NLRS reported saleyard prices posted gains in all reported categories, apart from Restocker Lambs which shed 4% to close at 649¢/kg cwt (Table 1).

East coast mutton was the stand out performer this week with an impressive 7% rally to 411¢/kg cwt. This was quite remarkable price strength shown by mutton, considering the unseasonably high numbers of sheep presenting at the saleyard. East coast mutton throughput is running 117% above the five-year average pattern for this time of the year, with elevated numbers particularly present at Victorian and NSW yards.

In contrast, the east coast supply of lamb dwindled during the week to see a drop of 14% to just over 145,000 head (Figure 1). Falling NSW lamb throughput is driving the east coast figures lower with a 32% fall on the week to see NSW lamb yarding levels trending 14% below the seasonal weekly average.

Perhaps NSW producers are responding to the falls of 15-50mm noted across much of the state this week (Figure 2).

Next week?:

A similar rainfall pattern to what we saw this week is expected for next week which may continue to provide some support to prices. Although, the big increases in Victorian lamb yarding levels are just around the corner as the Spring flush gets into full swing toward late October. This will act as a reasonable headwind on prices rallying too far.

A more likely prospect would appear sideways pricing movement at current levels in the short term with a continued downward bias as the Victorian lamb numbers start to flow. Additionally, the looming prospect of an El Nino is rearing its ugly head again as the BOM now forecast a 70% chance of one developing into late 2018/early 2019 and that’s going to weigh on producers optimism to hold or increase stock levels into the medium term.

Lighter Merino wethers looking profitable – if you’ve got feed.

It’s the time of year when Merino lambs from the Riverina and Western NSW start to hit the market. To date, these lambs have been selling well, given the seasonal conditions. We may see the market kick in the coming weeks and as such it’s worth looking at probable and possible margins on buying, growing, shearing and selling these lambs.

The best place to get an idea of Merino wether lamb prices is on AuctionsPlus. While there are store sales throughout the Riverina, AuctionsPlus (AP) gives us a weekly prices series as well as weight and descriptions which we can compare to finished lamb prices reported by Meat and Livestock Australia.

Figure 1 shows that there is plenty of variability in the AP price. Given most lambs on AuctionsPlus are sold on property, the location of the sale can have a bearing on the price, as can the weight of lambs. The data used here included lambs from 19 to 55 kgs liveweight.

The last month has seen the Merino wether lamb price lift strongly. The average price has gone from 250¢ to over 300¢, an increase of over 20%. Wether lamb prices aren’t quite at the highs seen in January this year, or May 2017, but given the seasonal conditions, they are pretty good.

Part of the reason for the lift in the ¢/kg rate is a fall in the average weight. The dry year has seen average lamb weights on AP fall to 27kgs, from 32kgs in 2017 and 37kgs in 2016. Buyers are getting lambs at much cheaper dollar per head rates and as such, are prepared to pay more in ¢/kg.

So is there any money in buying Merino lambs?  Surely with the wool price in the 99th percentile we can turn a buck on buying Merino lambs. The gross margins look good, but costs this year could be high (Figure 3).

Wool prices for 19 micron can be locked in at 2200¢ /kg clean for December/January and with a cut of 2.5kgs, this should return close to $40/head. Finished Merino lamb prices should be good in the New Year, with even the weak price of 600¢ delivering a gross margin of $76 per head.  The recently released forward contract prices, above 700¢, offer very good margins on growing out Merino lambs.

What does it mean:

We’ve had a look at gross margins, but of course, costs need to be factored in, with feed, freight, mortality and shearing costs all cutting into the gross margin. A quick calculation of a full ration at $500/t to put on 18kgs liveweight will cost $50-70 per head. The worst-case price scenario still looks pretty good (Figure 3).  The strong price, which can be locked in for February in some areas, might encourage stronger demand for Merino lambs in the short term.

If you have green feed on hand and are lucky enough to score some of the forecast rain for the coming week, feed costs will be lower, and Merino lambs will be a very good investment.

Key Points

  • Merino lambs are not cheap in ¢/kg but weights are well down, making them buyable in $/head.
  • Gross margins on growing out and shearing Merino wether lambs are good, but feed costs will make a large dent in profits.
  • If green feed is available in the medium term, wether lambs should be a profitable trade.

The bottom for lamb or a dead cat bounce?

The lamb market was following the trend of the last few weeks, until rain and an out of the blue bounce upset the market yesterday. The Thursday rally was felt across the categories, but was it just a dead cat bounce?

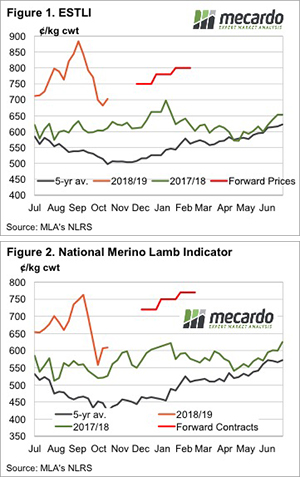
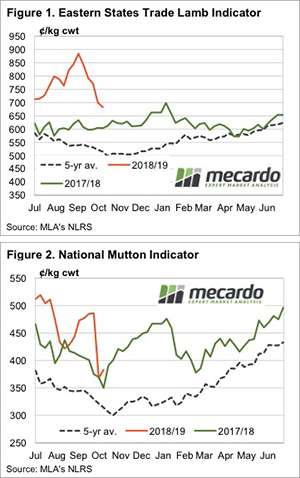
The market was moving along predictably enough. On Wednesday the Eastern States Trade Lamb Indicator (ESTLI) was down 57¢, hitting a 3 month low to 676¢/kg cwt.

Yesterday at Wagga the market changed direction. New season Trade Lambs averaged around 800¢/kg cwt, well above last week and the closing ESTLI of 682¢ (Figure 1).

There has been some rain about and the lower prices of the previous week added to supply resistance. Wagga lamb yardings were down 26%, while sheep yardings plummeted 44%.

There wasn’t a lot of rain around Wagga, but further north some good falls should see the NSW sheep market tighten significantly. Lamb might be a different story, with good prices still likely to draw out lambs which are finished, but it depends on what producers now see as good prices.

The crash in mutton was also halted on Thursday, as it sits just above the same time last year (Figure 2). The rain should be enough to see sheep slaughter continue to fall from recent highs and prices should steady.

Lamb and mutton prices also recently experienced a crash, but they too steadied this week.  No doubt rain in the west is adding support, along with the fact that with much cheaper lambs in the West should be seeing product moving quickly into export markets.

Next week?:

As noted earlier, the coming week should see prices steady. Despite the increase in lamb slaughter, it still sits well below full capacity. If we are close to the peak of supply, expect very good prices this spring.

An interesting stat to finish off. The East Coast Restocker Indicator finished Thursday at exactly the same price as this time last year. Higher finished lamb prices are being offset by higher feed costs.

Soaring yarding level raining on prices.

Elevated sheep and lamb yarding levels are soaring like an eagle at the moment and creating a stormy price conditions for ovine markets this week. The Eastern States Trade Lamb Indicator (ESTLI) shedding 55 cents to close at 725¢/kg cwt and East coast Mutton peeling off 79 cents on the week to sit at 423¢/kg cwt on the mid-week close. 

Table 1 highlights the sale yard price behavior for the week, and year, for key lamb and sheep categories across the Eastern seaboard with red ink on the weekly movement shared across all stock types. Heavy lambs suffering the smallest decline with a drop of 47 cents, perhaps anecdotal reports of a dearth of heavy lambs due to the dry conditions insulating somewhat against the broader market falls.

Indeed, with the year on year price change for heavy lambs still reflecting that this season is 140¢ higher than last year and East coast heavy lambs topping the price table at 739¢/kg cwt this week suggests that heavy lamb supply could be a bit thin on the ground in some regions.

In contrast, broader East coast supply statistics for lamb weekly throughput shows that the Spring flush continues to ramp up, probably with much lighter weight lambs. Throughput levels are now sitting back at the upper end of the normal seasonal range for this time of the season as Victorian lamb throughput lifts 27% on the week signifying the flush is gaining momentum – Figure 1.

East coast sheep throughput is lower on the week, but as Figure 2 highlights remains at uncharacteristically high seasonal levels. Considering the volume of sheep still being presented at the sale yard mutton prices are managing to hold above levels seen this time last season, with East coast mutton 35 cents higher than in 2017.

Please note sale yard prices reflect Wednesday market close as this piece was prepared Thursday due to the AFL holiday in Victoria on Friday.

What does it mean/next week?:

A combination of low rainfall, 10-15 mm likely for Southern Australia, next week and a continuation of lambs coming forward as the Spring flush extends is probably going to make it difficult for the ESTLI to gain too much traction in the short term.

Lambs tank but only to OTH levels.

Lamb markets continued to tank this week. It shouldn’t really come as a surprise, with the previous 850¢+ levels clearly unsustainable. Interestingly, over the hooks prices rallied, with saleyards and direct prices converging.

All lamb prices were smashed this week. The east coast indicators finished Thursday between 97¢ (restocker) and 43¢ (light lamb) lower, all back in the 700s, except for heavy lambs which managed to stay at 818¢/kg cwt.

Prices are, however, still way above the same time last year. The Eastern States Trade Lamb Indicator (ESTLI) has fallen 92¢ from the high but remains nearly 200¢ above the same time last year.  Prices may be down, but they are still very good.

Over the hooks prices continued to move higher this week, following saleyards in order to get supply. With the ESTLI falling back to a comparable level to over the hooks rates (Figure 2), processors should be starting to get some more lambs direct. Perhaps this is why saleyard values have lost some ground.

Mutton prices were stoic in the face of falling lamb values. As noted last week, mutton prices are still relatively cheap and processors are no doubt trying to fill up kills on animals which might still be making some sort of margin. The National Mutton Indicator rallied 10¢ for the week to a two month high.

It looks like lambs are starting to move in the West as well. Trade lamb prices fell 28¢ to 633¢/kg cwt, while mutton lost 34¢ to 428¢/kg cwt. With prices still historically very strong, there shouldn’t be any complaints about the lower values.

What does it mean/next week?:

The question now is how far lambs prices can fall. Supply can ramp up, but only to a point as we know the ability to finish lambs this year is limited. Values above 750¢ are likely to continue to encourage anything that is at trade weights to hit the market, but if they fall below 700¢, sellers might take a punt on putting more weight on and looking for upside.

Is mutton due for a moment in the sun?

The Eastern States Trade Lamb Indicator (ESTLI) eased this week despite declining supply at the saleyard and low slaughter figures, suggesting softening demand. In contrast, mutton prices have managed to gain ground despite stubbornly high throughput numbers for the last month and very much above average slaughter figures. Perhaps there’s something other than saleyard volumes and slaughter levels impacting the price at present.

The weekly trend in throughput for the 2018 season for lamb and sheep is highlighted in Figure 1, along with the respective five-year average pattern for yarding levels. Lamb throughput has dropped 30% from the previous week and sits 23% below the seasonal average. The low supply of lamb at present is replicated in the weekly lamb slaughter figures which are running 25% under the five-year average.

In contrast, sheep yarding has been holding firm above the average trend for eleven weeks now and currently sits 57% higher than the seasonal average. High saleyard numbers of sheep are flowing through to elevated mutton slaughter levels with the weekly sheep slaughter running 50% above the five-year average level.

Despite the alternative supply scenario for mutton and lamb, this week prices have responded against conventional wisdom with the ESTLI dropping 3% to close at 855¢/kg cwt while East coast mutton has managed to firm 2% to hit 481¢/kg cwt.

Perhaps the missing element is demand and more specifically offshore buying. Recent trade figures have shown declining volumes for lamb exports while mutton export levels have managed a stellar performance over August.

What does it mean/next week?:

A clue to the waning offshore demand for lamb and the firmness of offshore mutton markets could be the relative historic levels of each commodity in foreign currency terms.  The ESTLI is US$ terms has been approaching levels unseen offshore since the 2010/11 peak at around 670US¢/kg cwt (Figure 2).

In contrast, the offshore mutton price in US$ terms is only marginally higher than this time last season and remains over 100US¢/kg below levels recorded during the 2010/11 highs (Figure 3).  Perhaps there is some further upside for mutton in the short term, particularly if supply begins to tighten. At the very least, mutton prices may be able to hold their ground in the face of a weakening ESTLI as the Spring flush gets underway.

A look at cyclical price peaks in the merino market

Current merino prices are mesmerising. If you doubt this, take a look at prices being paid for stains, cardings and fine crossbred wool which can be used for blending purposes let alone the price levels for the broader merino categories. This article looks at how the current merino cycle fits with past price cycles.

Wool production has changed a lot in the past half century as has the inflation adjusted value of the currency. To accommodate these effects this article uses the average merino micron price series adjusted for inflation. This focusses the price on the core merino price, and brings past price levels up to current price levels in terms of inflation.

Figure 1 shows the deflated average merino micron price from the mid-1960s through to last week, with cyclical peaks (black squares) and cyclical low (red circles) shown. The 1973 and 1988 price cycle peaks stand out in Figure 1. In inflation adjusted terms price was stable from the mid-1970s to the mid-1980s. After the collapse of the Reserve Price Scheme the inflation adjusted price stepped down and traded in a fairly well defined range through to 2016, after which is has traded to higher levels.

Table 1 is a summary of the cyclical peaks shown in Figure 1. It shows the month of peak price, the monthly average price, the size of the price change from the previous cyclical low (in the case of 1973 3.00 means the price rose by 300%) and the time taken in months to go from the previous cyclical low to the cyclical peak. The median change in price from low to peak is 0.72, however there are a few small cycles from the peak RPS decade from the mid-1970s onwards. From 1988 onwards the median cyclical rise is 0.97 (a 97% rise in price or near doubling of price) taking a little of 2 years at 25 months.

So, where does that leave the current price cycle? In price terms the current market (August 2018) has risen by 0.99 from the last cyclical low, so it is around median level for rising cycles from the mid-1980s onwards. By this price rise standard the current cycle is nothing extraordinary, which is an interesting observation.

Strictly speaking the current rising cycle has been running for 71 months but in practical terms the cycle started to lift in late 2014 so the cycle is around 47 months old in Australian dollar terms. Either way the cycle is ancient by the standards of past cycles.

This analysis is designed to provide a base rate or base pattern for a rising price cycle in the merino greasy wool market. Each cycle will vary in the conditions applicable to the cycle. For example the 1973 cycle had a general commodity boom going on, the 2002-3 cycle was a classic post stockpile boom and the 2011 cycle was really a cotton boom. The current cycle has two observable features. Firstly the starting price was relatively high and secondly supply is low and about to be limited further by dry conditions.  At this stage the price rise is what we would expect from a standard cycle.

Key points:

  • The standard rising price cycle for the average merino micron price since the mid-1980s has resulted in prices doubling from the previous cyclical low.
  • These rising price cycles have generally taken around 2 years to play out.
  • This is the base pattern for rising price cycles.
  • In comparison the current cycle has risen by 99% from the previous cycle low, close to median , over nearly 4 years (twice as long as normal).

What does this mean?

Each price cycle will have its own peculiarities, so the median rising price cycle is only a guide to the standard pattern we can expect. At this stage the pattern tells us that price, which is high as it usually is in the upper section of a rising price cycle, has risen by a normal margin, although the time taken has been much longer than normal. It is not a super cycle.