Category: Lamb

2019 Outlook

In this series of blog articles, we’re taking a look back at the year that was for agricultural commodities and provide our insight for the year ahead. This instalment highlights 2018’s key movements in grain markets and what to keep your eye on in 2019.
The east coast of Australia has been ravaged by poor growing conditions in 2018. Although the drought has been widely publicised, farms have also been impacted by hail, storms and frost further exacerbating the already poor production potential.

The present forecast for wheat production in the eastern states (SA, VIC, NSW & QLD) is currently estimated at 7.2-7.5mmt. This is the lowest level since the 2006/07 crop and the third lowest in the past twenty years.

In the period since 2006/07, east coast domestic consumption of wheat has increased dramatically which intensified the impact as demand exceeds supply.

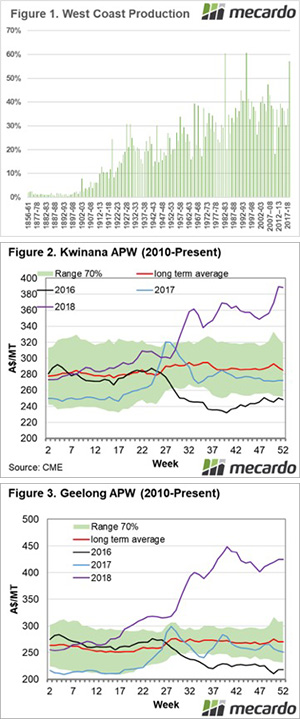
In contrast, Western Australia has taken the mantle of ‘production region of the year’. Although there were fears that frost would badly hamper Western Australia’s ability to produce a crop, however the fears were largely unjustified with production estimated at 9.6-9.9mmt. This marks only the third time in history that the west has produced more than 50% of the nation’s wheat (figure 1).

The northern growing region in New South Wales and Queensland suffered through a lack of rainfall during the winter production period. However, during the last three months of the year received above respectable levels of rainfall.

The late rainfall was welcomed by summer croppers, leading to increased planting. This rainfall will provide some surety to the sorghum crop, as there should now be sufficient moisture to get the crop through to a close to average finish.

The last quarter of 2018 has seen global markets unchanged, with the average for the quarter down 7¢ per bushel and up A$1/mt. This is largely unsurprising as the last quarter of the year has few surprises to move markets drastically higher or lower. This is due to the majority of the worlds grain harvest being complete, providing an element of clarity.

At a local level the picture is very different, with local pricing diverting from the international market due to drought conditions. This has resulted in wheat pricing in eastern Australia rising to levels not seen since prior to deregulation.

Domestic demand in the eastern states has led to substantial increases in pricing levels; Geelong +A$57 & Port Kembla +A$45. There has been a flow-on effect to WA prices, as transshipments price competitively.

What to keep an eye on in 2019

1 Politics / Global Trade

2018 was a year where trade scuffles broke out between the US and China. This lead to a lot of uncertainty in the market. Initially, the US targeted Chinese imports, however, retaliation by China targeted US agricultural exports.

The biggest impact was felt in soybeans with US exports into China being extremely important for American farmers (and Trump’s support base). The tariffs leave many questions about the capability of China to continue with trade restrictions. Over the past ten years, China has on average imported 62% of the worlds export soybeans. This places a huge strain on China’s ability to find alternate sources, especially considering the US is providing 40% of the world’s exports.

To satisfy the demand into China without paying tariffs, close to 100% of the global trade in soybeans (ex USA) will have to go into China. This has huge have flow-on impacts into other soybean destinations, which will likely change origin to the USA.

US-China negotiations are currently underway and have the potential to colossally impact our economy. A positive outcome will see strong trade flows between China and the US, which will then carry through to the Australian economy due to our reliance on China as a trading partner.

If negotiations end poorly, it is highly likely that the Chinese economy will stall due to the importance of the US economy to their manufactured exports.

2 Weather

The first half of 2019 will see all eyes look to the skies above the northern hemisphere. This is the important period of time where the 2019/20 crop will be made. 2018 was the first year in the past five where production fell below consumption. The world was assisted by strong stocks globally, however, the situation will be tighter this year with the majority of stocks held in China.

China as a nation is a large producer and have huge stockpiles in their inventory, yet it very rarely sees the light of day in the export market. The average exports from China since the turn of the decade have been 917kmt. The largest year of exports since 1960 was in 2007/08 with 2.8mmt. The high domestic price in China (Gov intervention) and historical precedence would point to China being unlikely to come to the aid of the global trade.

When we exclude Chinese stocks from the global situation, the world is sitting on similar levels of stocks to 2008/09 and 2012/13. These were both periods when futures prices rose dramatically and importing countries were hit especially hard with food prices rising, especially in 2008.

This means that major production issues in Europe, the Black Sea or the US could lead to a drastic upward movement in pricing at a global level.

3 Local Conditions

Prices in Australia have risen dramatically due to strong domestic basis. Pricing levels are the highest since the start of the deregulated market. We can see in figure 2 & 3, that these prices are ‘abnormal’ compared to the past ten years.

It is important to understand that these prices are not the ‘new, new’. If we have an average or above year in 2019, the premiums currently in the market will erode very quickly. The market will move back to a pricing point based on the export market and will align with international values.

At present no-one knows how the weather will treat us in the next year. If anyone tells you that they do; they are guessing. It therefore makes sense to investigate the forward market either through physical or futures to commence a structured sales plan for 2019/20.

However, if Australia experiences another drought we will see basis remain at strong levels.

Live export buyers underpin WA prices.

An expanded cross bench in Federal parliament has placed the ban on live sheep exports back on the agenda. Mecardo thought it an opportune time to reaffirm how important the live sheep trade is for WA farmers, particularly in terms of prices they receive at the sale yard compared to their east coast counterparts for lamb and mutton, when live export buyers are active.

Price spread discounts for WA Trade Lamb and WA Mutton continue to narrow as live export buyers re-enter the market, bringing prices in the West Australian sale yards back in line with East coast prices.

The WA Trade Lamb spread pattern to the Eastern States Trade Lamb Indicator (ESTLI) shows that reduced live export volumes through the winter period saw WA producers earning 230¢ less per kilogram carcass weight than East coast producers – Figure 1. However, since the re-entry of live export buyers into the final quarter of the season the spread discount has narrowed significantly for WA Trade Lamb, sitting just below what is normal for this time in the season at a 22¢ discount to the East coast.

In a similar manner, WA mutton spreads to the ESTLI widened to a discount of 450¢ during late Winter as live export flows of sheep ground to a halt, well below what would be considered normal seasonal variation as identified by the grey shaded 70% range boundary – Figure 2. Increased activity of live exporters into the final quarter of 2018 have seen WA mutton spreads improve moving back into the normal range in recent weeks for the first time since July 2018.

Comparing the average monthly spreads for WA Trade Lamb and WA mutton to monthly live sheep flows we can see a relatively clear deterioration in prices being achieved by WA producers, compared to the East coast markets as live sheep export volumes declined from May through to August – Figure 3.

The relationship between live sheep export volumes and WA price spreads can be further demonstrated by the monthly correlation pattern between spreads and live trade volumes– Figure 4. Higher trade volumes clearly coincide with improved spreads for WA producers with WA mutton demonstrating a slightly stronger correlation coefficient (R2) of 0.6846 compared to WA Trade Lamb with a coefficient of 0.6164.

Our previous two articles on WA lamb and mutton spreads can be found on the links below

What a difference a shipment makes.

A reversal of fortune for WA producers.

What does it mean/next week?

It is pleasing to see price spreads in WA markets normalize in recent weeks with the reintroduction of more sale yard competition in the form of live export buyers. Hopefully, as Federal members deliberate the bill seeking to phase out the live sheep trade they will pause to reflect upon how important the trade is to WA farmers and the industries that support them, such as transport, fodder suppliers, merchandise stores, etc.

If those seeking to ban live sheep exports are successful it is likely just a matter of time before their target will shift toward the live cattle trade. What will be their next target if they achieve success here too? Banning intensive animal farming practices in the beef feedlot, pork, chicken and egg industries, banning long haul animal transport over land and/or any shipments of live animals overseas? It’s a slippery slope and for a member of parliament like Andrew Wilkie, representing the Tasmanian electorate of Denison, I wonder if his support for the banning of live export sheep overseas extends to the shipment of Tasmanian live sheep (and cattle) over the sea to the mainland?

Key points:

  • WA price spreads for Trade Lamb and Mutton have improved significantly since the re-emergence of live export buying competition in the last quarter of 2018.
  • A strong relationship exists between live sheep export trade volumes and WA price spreads to East coast markets for Trade Lamb and Mutton.

How lamb price perspectives can change in a year.

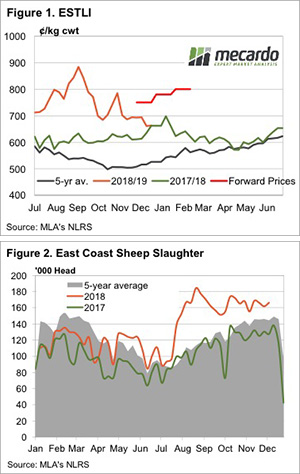
Perspective is a funny thing, especially when it comes to commodity prices. This time last year the Eastern States Trade Lamb Indicator (ESTLI) hit a new record high of 661¢/kg cwt and lamb producers went into Christmas a very happy bunch. This year the price is the same, but the mood is not as buoyant.

Lambs are the same price, but many producers are not seeing great prices, they are counting the missed opportunity of locking in prices at over 100¢ better than current values (Figure 1). Prices over 800¢ are also a recent memory, which adds to the perceived loss.

We know, however, that prices over 600¢ are highly profitable for those lamb businesses which haven’t been in drought, and hence the flow of lambs this November and December has been strong.

There will be some interesting supply and demand functions over the coming month. The rain falling this week should encourage retention of lambs. However, anecdotal reports suggest many Victorian processors are fully booked for January.

We may see light lamb prices rally and finished prices steady, that is unless the dearth of supply in NSW worsens and drags all prices higher.

Sheep is another story.  It’s very hard to see sheep slaughter maintaining current levels with crucial northern sheep regions getting a good downpour. We haven’t seen mutton indicators above 500¢ for any extended period of time since the middle of 2017. Next year could be a record breaker for mutton.

What does it mean/next week?:

There will be some sales early next week, but things will be quiet after that. Many of the lambs which will be killed between now and early January will have already been booked, so sending lambs to the saleyards might be a raffle.

Flush nearing completion.

Victorian lamb numbers continue to swell, hitting levels similar to last year’s peak and pushing East coast lamb numbers to levels not seen since January 2018. Sheep numbers at the sale yard have also rebounded over the last few weeks and the result has been softer lamb and mutton prices across the board.

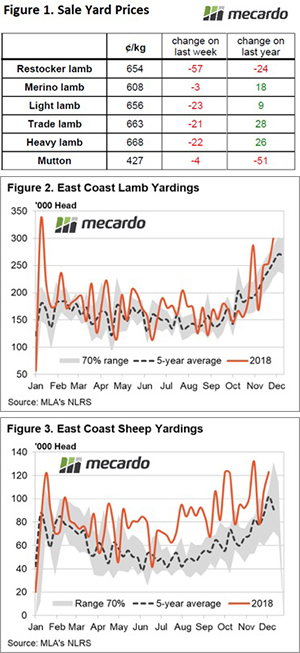
East coast sale yard prices for the commonly NLRS reported categories of lamb and mutton are outlined in Figure 1 and it shows that the increased throughput having an impact on all prices, although only minor falls registered for Merino Lamb and Mutton.

Restocker Lambs taking the biggest hit with an 8% drop to close at 654¢/kg cwt. The Eastern States Trade Lamb Indicator (ESTLI) posting a more modest 3% fall to finish the week at 663¢/kg cwt. Interestingly, we are now nearing the area we originally suggested the ESTLI was likely to bottom out once the Spring flush was competed.

Back in October we released an analysis piece suggesting the bottom would be found around the 630-650¢ level in late November. Granted, we are little late with the timing but its near enough now to call the bottom for the ESTLI given there can’t be too much more of the Spring flush to play out.

Victorian lamb yardings gaining 25% week on week to see 148,298 head recorded. This time last season the Victorian yardings peaked at 147,363 so it is fair to expect there can’t be much more lambs to come in the next few weeks. East coast lamb yardings boosted by the Victorian flow, registering just short of 300,000 head presented, to see the highest weekly total throughput since the start of the season – Figure 2.

A similar story for east coast mutton throughput too this week with a 15% gain in numbers week on week to see nearly 123,000 head yarded. A surprising number of sheep still being offered up, given the elevated yarding we have been seeing along the east coast since the middle of the year.

What does it mean/next week?:

The next week has some pretty good rainfall forecast for much of Victoria and Southern NSW, with up to 50mm expected across a broad area. This is likely to encourage any remaining stock to be held a little longer by producers so expect prices to stabilise and don’t be surprised to see a little kick higher as we head toward the Xmas break.

Mutton still dragging the chain.

With some wild variation in lamb and sheep markets this year it is unusual to see a relatively steady week. But this is how it panned out this week, with relatively steady prices across the east coast indicators. However, delving deeper into state data hints at what may be to come.

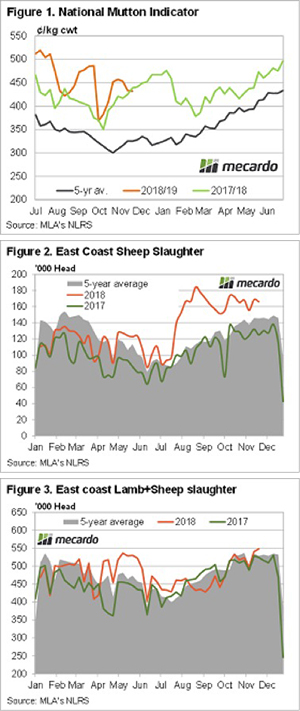
Mutton prices remain well above the five-year average (Figure 1), but this week have again fallen below last year’s levels. With the National Mutton Indicator at 431¢/kg cwt, it was well outstripped by NSW Mutton this week, which sits at 460¢.

Dragging the national average back was Victoria (404¢) and South Australia (336¢). In the West, the Mutton market is close to the national average at 421¢/kg cwt.

Still, Mutton is being slaughtered hand over fist. Figure 2 shows mutton slaughter 33% above the same time last year and 14% above the five-year average. The last time we saw slaughter at this level in the spring was in 2014.

Total Ovine slaughter is shown hitting 548,000 head in Figure 3. It has been four years since the supply of lamb and mutton has been this strong. At that time the Eastern States Trade Lamb Indicator (ESTLI) was at 466¢ and mutton at 295¢. This is a good snapshot of how far demand has come.

The ESTLI finished Thursday at 684¢/kg cwt, supported by NSW where Trade Lambs were 728¢, but dragged lower by all the other states.

What does it mean/next week?:

Rain in NSW this week should continue to help boost demand and should start to limit supply. The flow of mutton has been very strong and we suspect it can’t continue once grass is available. With lamb price still well above last year’s levels, we expect mutton to make up some ground before lamb makes its next move higher.

Increased yardings, easing prices.

A rebound in lamb yarding levels along the East coast was noted this week as the sales program returns to normal post the Victorian Spring Carnival events. The increased supply is weighing on prices marginally, despite the support offered by some reasonable rain to the Eastern half of Victoria and NSW.

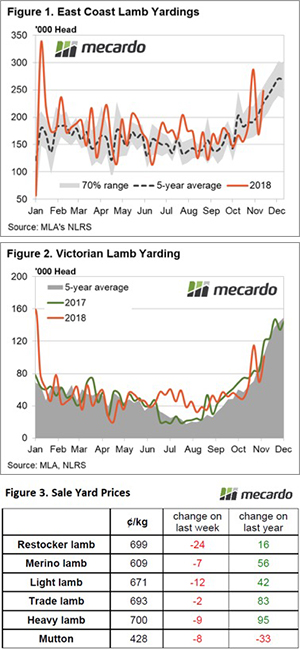
Lamb throughput levels increased 47% on last week’s lull in saleyard offerings, to see it back above the seasonal average by 10% as nearly 250,000 head changed hands (Figure 1). All mainland states contributed to the increase in lamb yarding with NSW lamb throughput levels showing uncharacteristically high volumes for this time in the year, sitting 36% above the five-year average.
South Australian lamb yardings saw a gain of 37% on the week but appear to have reached their spring flush peak a fortnight ago, now sitting 12% under the five-year seasonal average trend. Victorian lamb throughput is back on track for a Spring flush peak during November/December, staging a 46% rebound from last week to see over 101,000 head yarded (Figure 2).

The increased supply of lamb is weighing slightly on prices across the East coast with all NLRS reported categories of lamb registering falls between 2 – 24¢. The Eastern States Trade Lamb Indicator (ESTLI) lost the least ground in the face of the additional lamb numbers, closing yesterday at 693¢/kg cwt (Figure 3).

In the West, trade lambs are continuing to play catch up to the Eastern states prices with a 17¢ increase on the week to close at 641¢/kg cwt. The WATLI managed to climb despite lamb throughput levels running 54% above the seasonal average.

What does it mean/next week?:

With rainfall for the next week mainly confined to Southern Victoria, there isn’t an obvious catalyst to get lamb and sheep prices probing higher. The Victorian spring flush still has a few more weeks to run, so price pressure on lambs is likely to continue to persist into the short term but don’t expect them to drop away too far. Consolidation in price at current levels is probably the most likely scenario over the next few weeks.

Lamb finds a base to bounce off.

The lamb market seems to have found a level it was happy with this week. With supply disruptions due to the Melbourne Cup, it’s hard to get a gauge on supply, but it appears we might have seen the spring low.

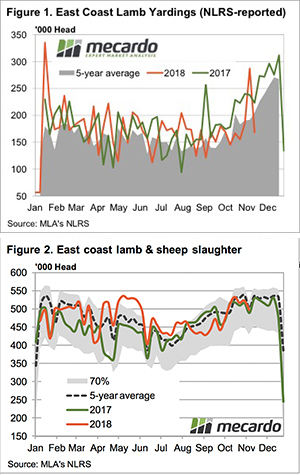
The latest yardings reported by Meat and Livestock Australia (MLA) are to the end of last week.  Figure 1 shows that the Melbourne Cup holiday, along with the lower prices, saw a 39.6% decline in yardings. The supply decline saw 119,000 fewer lambs hit the yards across NSW, Victoria and SA.

A quick look at this week’s lamb reports tells us supply has bounced back. Victoria yarded over 100,000 head, which is around normal for this time of year.

Slaughter numbers also tell an interesting story. Figure 2 shows the total sheep and lamb slaughter for the east coast has been close to last year’s levels. Despite stronger prices than last year, processors still seem to be able to make a margin.

Figure 3 shows the Eastern States Trade Lamb Indicator (ESTLI) has again bounced off 680¢ to this week post a 17¢ gain to hit 695¢/kg cwt. There was, however, a decline in prices at Wagga on Thursday, which dragged the ESTLI back from 700¢.

WA Trade lamb and mutton prices managed to maintain their strong levels this week, at 627¢ and 405¢/kg cwt respectively. It’s interesting, however, to see WA restocker lambs back at 554¢/kg cwt.  With cheaper grain in the west, you’d think there should be a narrower spread between restocker and finished lambs than in the east.

What does it mean/next week?:

Growers seem to have shown their cards, with prices under 700¢ now seemingly a hold for many.  It shouldn’t be surprising, with forward contracts close to 800¢ a recent memory.

With more rain forecast for the coming week across parts of NSW and key Victorian and South Australian areas, there might be more sheep and lambs held, and higher prices.

East coast lamb yarding levels off like a rocket.

The spring flush is well underway now and the increased numbers at Victorian saleyards this week contributed to an extra 100,000 head of lamb exchanging hands. Although swelling yarding levels weren’t contained to Victoria this week with SA, NSW and WA all posting increased figures.

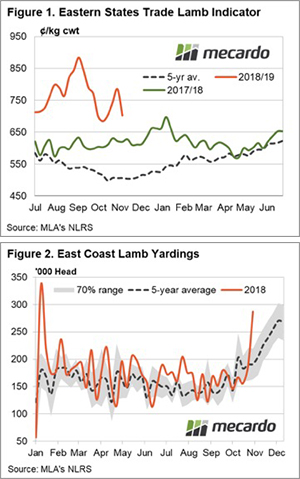
The impact of the additional supply saw prices ease across the East coast for all NLRS reported categories of lamb. The Eastern States Trade Lamb Indicator took the biggest hit on a ¢/kg basis, with a 33¢ drop to close at 678¢ (Figure 1). Price falls ranged from 12¢ to 30¢ for the remaining lamb categories (Table 1).

East coast lamb yarding levels are up 55% on the week to see 286,762 head reported, well outside the normal seasonal range that could be expected for this time of the year and 49% above the five-year average (Figure 2). The additional lambs across the east coast came from all states, with NSW lamb yardings up 34%, SA up 99% and Victoria increasing 72% from the previous week’s figures.

In the West, lamb yardings were higher too, up 23%. However, the impact on price of the additional supply was restrained as trade lamb prices have been supported by the resumption of the live trade. Mid-week reports for the Western Australian Trade Lamb Indicator saw it gaining 50¢ toward 625¢/kg cwt. As we reported earlier in the week, the spread discount between East coast and West coast trade lamb has narrowed significantly since the return of additional buying competition in Western Australia with RETWA being granted an export license.

East coast mutton prices continue to hold firm, easing a meagre 3¢ on the week to close at 428¢/kg cwt. Mutton prices remain solid despite prolonged levels of sheep slaughter. Indeed, from July to November weekly mutton slaughter rates have been trending 30% higher than the seasonal average but it hasn’t been enough supply to soften prices significantly. Offshore demand is continuing to soak up the excess it appears – stay tuned for an update on mutton exports next week.

What does it mean/next week?:

As our analysis yesterday pointed out, it appears the Victorian spring flush for Bendigo is completed and Ballarat’s numbers are looking to peak soon too. That only really leaves Hamilton as the remaining saleyard to contribute to the final surge of lambs as we head toward the end of the year.

Downside for the ESTLI is probably going to be limited to the 630-650¢ region as outlined in our Mecardo analysis piece from 18th October entitled “A season spent at the edge of normal” and expect a recovery back above 700¢ reasonably quickly after the spring flush subsides.

Bendigo nearly done but spring flush just begun.

We have been talking about Victorian lamb yardings for a couple of weeks now. Firstly, they were lower than normal, then they rapidly picked up last week, to be much higher than normal. We thought it timely to take a look at seasonal supply trends across the major yards, and what this might mean for supply, and price, in the coming weeks.

There is a strange dynamic in lamb markets, where for most of the year NSW contribute most of the east coast yardings, while Victoria has the largest slaughter. In the spring and early summer, Victoria briefly takes the mantle for strongest yardings, pushing east coast levels over 250,000 head.

Figure 1 shows east coast lamb yardings and the impact Victorian yards have during the last two months of the year. During October, lower Victorian yardings saw total east coast yardings track below last year’s levels and the five-year average. The October dearth seems to have been caused by weaker new season lamb supplies at Bendigo and Ballarat. The Ballarat lambs might still be coming, but we suspect the Bendigo lambs were never there.

The Bendigo spring flush is dwarfed when Ballarat and Hamilton get going in November and December. Figure 2 shows Ballarat last week was not far off its peak young lamb supply and the flow is just beginning at Hamilton, with 8000 last week and 11,500 head today.

In November and December 2016, Ballarat and Hamilton yarded 593,000 head of young lambs. In 2017 it was 587,000, which is remarkably consistent, but the seasons were similar in terms of good spring rain.

This year spring has been dry for Western Victoria, not disastrously, but dry enough to see plenty of producers contemplating turning off lambs which traditionally might have been shorn and carried through to the New Year.

We are already seeing a good supply of restocker lambs keeping a lid on prices. Figure 3 shows the National Restocker Lamb Indicator is only marginally ahead of last year, despite the recent very strong finished lamb prices.

What does it mean/next week?:

With a big flush of lambs still to come out of Western Victoria, don’t expect store lamb prices to improve too much before Christmas. We have seen restocker lamb indicators hold well relative to the recent fall in trade and heavy lamb values, and this can be put down to the forward contracts on offer.

However, if supply overcomes demand from restockers over the coming month or six weeks, restocker lambs might well become a hold as the spring flush of lambs ramps up.

Key Points

  • Victorian saleyards have been a bit slow in October, but supply from Hamilton and Ballarat is about to ramp up.
  • Restocker lamb prices are holding relatively firm at last year’s levels but will face supply challenges.
  • If restocker lamb prices fall there might be some tough decisions for those supplying lambs between now and Christmas.

Hold, Hold, Hold, Now!

Those familiar with the movie ‘Braveheart’ will recall the scene where Mel Gibson and co are facing a cavalry charge from the English Army. Mel said ‘Hold, hold, hold, now!” and the Scottish rebel impaled the English horses on spears and subsequently won the battle. It’s a weak analogy, but with Victorian lamb producers facing encroaching dry conditions, they have held, and held, and held, until this week they raised their spears, but were themselves impaled. Metaphorically, not literally.

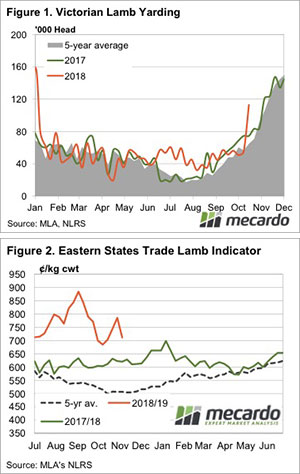
After Matt’s article last week, and earlier this week, looking at Victorian lamb yardings, or lack thereof, this week the lambs appeared (Figure 1). The lift in supply was felt across all yards, with Naracoorte in South East South Australia also seeing a big rise.

With plenty of lambs and sheep seemingly booked in over the hooks, prices tanked sharply. Normally we don’t see Victorian lamb yardings over 100,000 head for another month and so processors definitely didn’t have the space to kill them.

When supply overwhelms demand, prices fall. Although, there was some good news. The Eastern States Trade Lamb Indicator (ESTLI) fell 77¢ but only back to the levels seen three weeks ago. Processors and restockers were happy to buy lambs at the lower levels, even if they weren’t to be killed this week.

All lamb prices fell this week, but mutton ‘only’ lost 35¢ to sit at 431¢ on the east coast and 400¢ in the west. While in the west, lamb prices rallied, gaining 9¢ to 575¢/kg cwt. Still well behind the east, but on the way up.

Next week?:

The high prices of the last couple of weeks, along with dry weather, encouraged growers to offload lambs this week. The test will be whether supply continues to flow, or if it pulls back with lower prices. The Melbourne Cup usually sees lower yardings next Tuesday, so we might not get a real indication until the following week. The relatively strong prices in the face of heavy supply are encouraging, however, at least for well-finished lambs.