Tag: Articles

Rising Tide lifts all boats

It was a steady and solid opening to wool sales this week, which offered a welcome respite to buyers and sellers alike from the recent wild roller coaster ride for wool prices over the past month. With lifts in price across the board, the pass-in rate retreated to single-digit figures.

This rising sentiment continued to the close of selling, with AWEX late on Thursday reporting Fremantle market “strengthening all the way to the final hammer.”
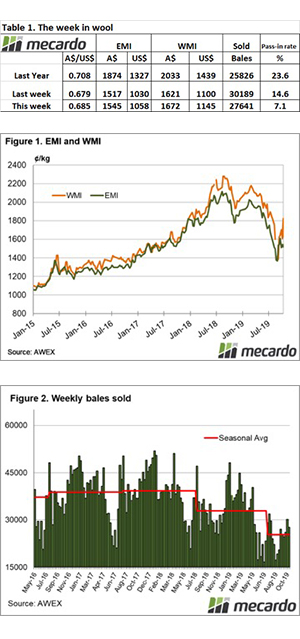
The Eastern Market Indicator (EMI) gained 28 cents (after losing 26 cents last week), to close at 1545 cents. The Au$ also rose to US $0.684, and resulted in the EMI in US$ also rising 28 cents to settle at 1,058 cents. The WMI had a strong week benefiting from selling last, rising 51 cents to 1672.

The market improvement was general and across the board. Gains of 1.5 to 2.4% were reflected across the range of MPG categories, a case of a “rising tide lifting all boats”.

A look at the relative centre offerings shows that with Sydney only selling on day 1, it only offered 4,972 bales to sell 4,577, while Melbourne over 2 days sold 14,627 out of the 15,498 bales that came forward. Fremantle passed in 8.3% of the 6,607 bales offered, for a clearance of 6,057.

There was a much-reduced offering of 29,760 bales this week, almost 6,000 bales fewer than last week’s volumes. The National Pass-in (PI) rate was half of last week at 7.1%, which meant 27,641 bales were cleared to the trade, 2,548 less than last week. The supply shortfall is still significant, with 113,600 fewer bales sold so far this season compared to the same period last year. This equates to an average weekly gap of 8,114 bales since July.

The dollar value for the week was $48.93 million, and a bale average value $1,770. The combined value so far this season of $614.50 million.

Crossbreds performed in line with the general market, while Cardings were quoted up 3%, however it was only Melbourne & Fremantle centres that contributed to the rise.

The week ahead

All centres return to selling both Wednesday and Thursday next week, with an increased offering of 39,000, 10,000 more than this week.

Despite the increased offering, the positive end to sales this week should provide a solid platform for next week.

A little give and take

The shaky wool market opened this week lacking power. With a decent offering, the first day of sale saw instant corrections across the board, only to show signs of a resurgence at the days’ end.  This momentum carried through to a stronger market on Thursday, however it wasn’t enough for the market indicators to avoid overall declines on the week.

The Eastern Market Indicator (EMI) lost 26cents (after gaining 32 cents last week), to close at 1517cents. The Au$ also rose to US $0.678. This buffered some of the fall in the EMI in US$, dropping 12 cents to end the week at 1,030 cents.

The Fremantle sales proved weaker than its eastern counterparts on day one, falling 42 cents before regaining some ground on the second day of sale. The Western Market Indicator lost 32 cents on the week to close at 1,621 cents. AWEX reported that despite the price rises on day two, there were still many unwilling sellers, resulting in nearly 20% of the fleece passed in.

There was a much higher offering of 35,356 bales this week, an extra 7,207 bales on last week’s volumes. The National Pass-in (PI) rate was 14.6%, which meant 30,189 bales were cleared to the trade. This is the first week since March that we have seen the number of bales sold actually higher than the corresponding week last season. Of course, the supply shortfall is still significant, with 115,415 fewer bales sold so far this season compared to the same period last year. This equates to an average weekly gap of 8,878 bales.

The dollar value for the week was $52.97 million, for a combined value so far this season of $565.68 million, and a bale average value $1,732.

Crossbred were the worst performing category this week, losing 10 to 55 cents across the microns. After last week’s losses, the Cardings Indicators again held their ground with just a 5 cent average fall.

The week ahead

A smaller offering is rostered for sale next week of just 32,970 bales. Sydney is down to just one day of sale on Wednesday, while Melbourne and Fremantle are selling both Wednesday and Thursday.

Let’s hope the positive tone moving through the market at the end of this week carries through.

Spring mutton dressed up as lamb

There has been plenty of commentary around the spring rally in mutton prices and last week we saw the unusually strong prices almost hit a record in Victoria. Sheep markets have rarely been stronger and normally it’s the price low that we see at this time of year. So should growers be selling ewes rather than lambs?

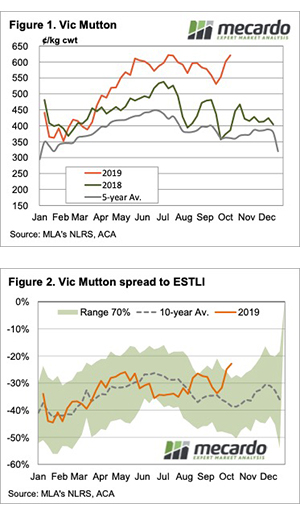
The credit for rising mutton prices has been squarely placed with Chinese demand. Increasing demand can be the only answer when we see price rises like the one shown in Figure 1.  The 10% rise in the Victorian Mutton Indicator from the low has been accompanied by an 11% increase in slaughter. Rising supply and rising prices equals stronger demand.

The Victorian Mutton Indicator is 61% stronger than the same week last year. That is more easily explained by supply, with east coast sheep slaughter down 22.5% on September last year.

The relative price of mutton has also hit some milestones. The Victoria Mutton Indicator last week moved to just a 23% discount to the Eastern States Trade Lamb Indicator (ESTLI). Mutton hasn’t been this close to lamb since May 2018, although it was in October 2016.

Figure 2 shows the steady ESTLI and rising mutton price has the spread at levels well above the normal range for this time of year.

As we move towards the end of spring and paddock feed supplies start to dwindle, sheep producers will start looking at what to sell. We know that sheep and mutton both have further potential upside, but it looks like there might be more upside in lamb.

Lamb prices averaged 10% higher than current prices in May, June and July, while mutton values have rarely been higher. Cast for age ewes are very good selling at the moment, as are lambs, but there is likely more upside in young stock than old. This is especially the case for young female stock when the drought breaks.

What does this mean?

Strong mutton prices make selling decisions relatively easy this year. Older ewes might have another 5% upside in the meat market but lambs are more likely to rise, and will rise further.  In order to conserve feed, any older ewes which are left can be cashed in, and efforts concentrated on finishing lambs or getting ewe lambs up for joining. Young ewes are going to be the real winners when it rains.

Lower production, lower prices

Many crop forecasters are calling the crop lower. It is therefore confusing for many why the price for cereals is dropping rather than rising. This time last year ASX wheat was A$444/mt, this week it is trading at A$353/mt. Why is that happening when the crop is in poor condition?

A small crop gets smaller is an adage that stands the test of time in Australia. The estimates for this year’s wheat crop are varied from 15.5mmt to 18mmt. I personally think the headline number is irrelevant. In a year like this (and last year), we need to be thinking of Australia as two countries – east and west.

I have mentioned a number of times in our weekly podcast and a number of articles (here, here & here) that the distribution of grain in the country would lead to lower prices than last year. The headline number is liable to be around similar levels to last year, but that doesn’t mean prices will be the same.

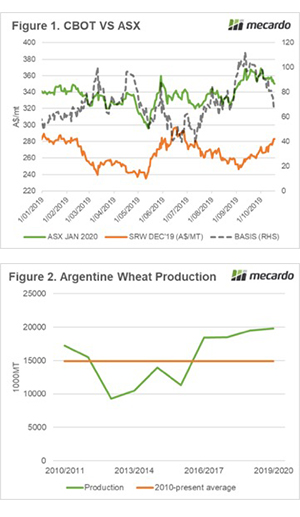
The ASX wheat contract rose during September, however, it has remained locked within a narrow trading range of A$350 to A$360 (Figure 1). In the past week, we have seen a softening of pricing with the average close this week at A$353. This is A$88 lower than the same week last year.

The ASX falling has come at a time when CBOT for a comparable period has been rising. This has resulted in basis falling to A$67. The high in recent months has been A$112.

Recent times have seen corn being the main driver, however, wheat led the charge in cereals overnight. This has resulted in December futures riding to a three month high. The market has been driven by wheat concerns around the world cold/snow (US & Canada) and dry (Australia & Argentina).

Early in the season, Argentina was on track to produce a record-breaking crop, with estimates up to 21mmt. However dry weather has resulted in a series of downgrades to 19.8mmt. This is 300km higher than last year and nearly 5mmt higher than the decade average (Figure 2). Although we may see production fall further, the impact on the record global balance sheet is likely to be minimal.

Next week:

The ASX market has fallen over the past week and is testing <A$350. If this occurs, we may see an uptick as consumers cover requirements at a lower level.

It is going to be a very volatile harvest as what grain that has been produced comes to market over the next two months.

Markets primed for rain

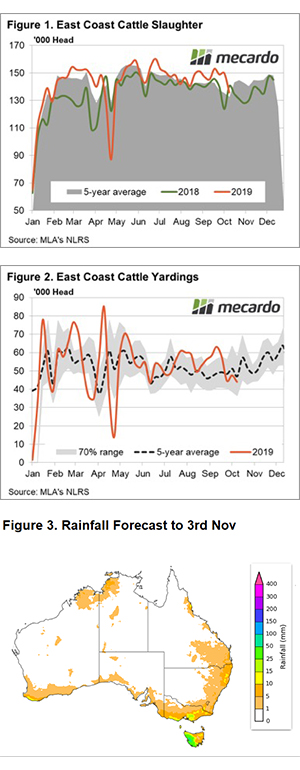
Measures of cattle supply across the east coast probe lows not seen in many months and prices across categories are mixed on the week. The reduced supply points to a chance for a rally but the lack of rain is hampering the bounce, despite solid offshore demand and strong export prices.

East coast cattle slaughter levels dipped in recent weeks to record the lowest weekly figure recorded since the Easter hiatus this season. Weekly slaughter levels dipped below the 2018 trend for the first time since early August and are running 11% softer than where it was a month ago (Figure 1).

East coast yardings are displaying a softer trend too, with the lowest weekly figure recorded since mid-June. Since the end of September, average weekly east coast cattle yarding levels have been running 7% below the five-year seasonal pattern, further reflecting the tight supply (Figure 2).

Young cattle prices on the east coast have responded kindly to the tighter scenario with the Eastern Young Cattle Indicator (EYCI) lifting 3.5% to close at 503.25¢/kg cwt.  East coast feeder steers also managed a slight gain, up 2.25¢ to 286.5¢/kg lwt.

East coast heavy steers were less reactive, with a 3.5¢ drop to close the week at 309¢/kg lwt. Despite the weekly easing, east coast heavy steers remain at a premium to the EYCI as tight supply of quality finished cattle and a lack of rain continues to favour the heavier stock.

Next week

The BOM issued rainfall forecast for the next fortnight signals limited to no falls in all regions but the western half of Tasmania (Figure 3). Young cattle prices will continue to face headwinds while the rain outlook remains pessimistic.

There remains some good upside potential for prices should the climate start to comply.  The 90CL beef export indicator lifted again to 755¢/kg CIF and the Mecardo analysis published yesterday on the 90CL indicates that the EYCI could go to a 50¢ premium to the 90CL if we get a decent enough break in 2020.

All red for sheep and lamb

Seeing all red on the Eastern States Daily Indicator Report for weekly sheep and lamb movements has been a rare occurrence recently.  This week finally saw enough stock come to market to send prices lower.

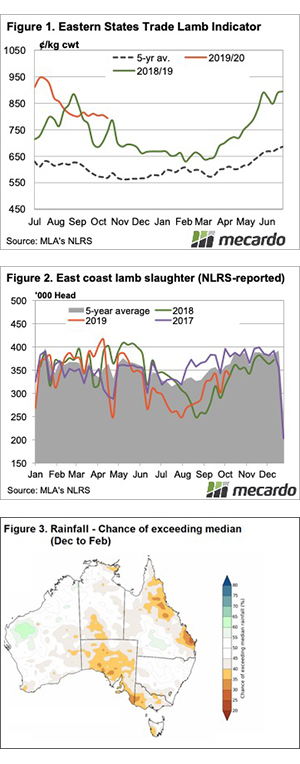
Week on week falls in sheep and lamb prices weren’t huge, but the Eastern States Trade Lamb Indicator (ESTLI) did hit a five-month low, breaking under 800¢ for the first time since May (Figure 1).  The ESTLI isn’t far off where it was after a brief spike in October last year, but it has found plenty of support around this level.

Merino lambs were the heaviest hit in terms of falls, the east coast indicator lost 44¢ to hit 716¢.  The Merino lambs seem to be coming in NSW, where they are 707¢, while in Victoria they are stronger, at 751¢.  This is the opposite spread of trade lambs, which tells us merino lambs are flowing in NSW, trade lambs are not.

Lamb slaughter was lower last week, but that was due to a public holiday.  Slaughter is likely to be higher this week but looking at last year’s trends (Figure 2) it could gain another 10%, which would put some pressure on prices.

The weaker Aussie dollar is giving lamb prices some support.  In US terms the current ESTLI premium over last year’s low is 100¢, in our terms it’s at 125¢.  There is likely to be a downside, but we don’t think it will hit last year’s levels.

Next week.

The fortnightly Bureau of Meteorology (BOM) outlook is a bit more positive this time.  Figure 3 shows the December to February outlook, we left November out as it’s not great.  We might have to wait until the New Year to see the rain, which will bring the price upside.  In the short-term downside is more likely, but it won’t last long.

Early flush soaked up by offshore players

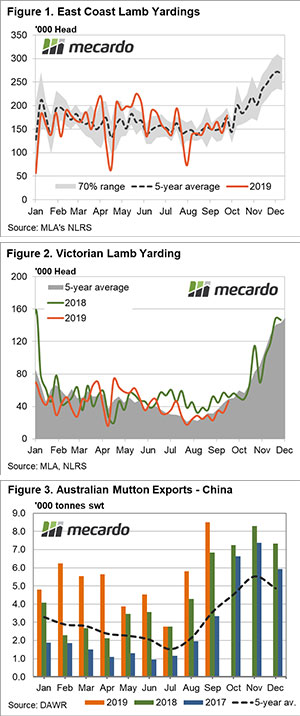
Lamb yarding numbers are starting to climb across the east coast fueled by lifting Victorian throughput as the spring flush gets underway. However, prices are yet to dampen as a resurgence in offshore demand, particularly from China has export buyers scrambling to fill orders.

Weekly east coast yarding levels reached the highest they have been since late July jumping 26% from the prior week and is closing in on 180,000 head (Figure 1). Driving the east coast volume of lamb is the lift in Victorian numbers signalling the early stages of the spring flush.

Victorian lamb throughput is 104% up on levels from a month ago and is nearing 50,000 head per week. Despite the additional volumes most categories of Victorian lamb prices increased this week indicating demand is more than compensating for the extra supply (Figure 2).

Indeed, lamb and sheep prices have lifted across all categories reported by NLRS for eastern states indicators, with restocker lambs, light lamb and mutton leading the charge higher. East coast Restocker Lambs posted a 19¢ gain on the week to close at 878¢/kg cwt, Light Lamb is up 20¢ to 800¢ and East coast Mutton is performing exceptionally well (particularly in percentage terms gains) with a 19¢ lift to close at 605¢.

September trade exports figures give us a clue as to why lamb and mutton prices are holding up so well in the face of the start of the spring flush. This is particularly true for flows going to China to fill the protein void created by the African Swine Fever (ASF) epidemic. Mutton flows from Australia to China have increased 208% from July to September and year to date Chinese demand is running 108% above the five-year seasonal trend (Figure 3).

Next week

The strong resurgence in offshore demand for Australian lamb and mutton product is timely given that throughout volumes are set to extend higher as we proceed through spring. The big unknown is how large the appetite from China will grow as we head toward the end of the season.

There is a good chance that an ASF led lift in Chinese demand for mutton and lamb, over and above the normal spring increases in Chinese trade volumes, will see prices underpinned throughout the next few months. This will limit the depth of the traditional spring flush price decline.

It’s a rollicking ride for wool

It concerns me that we are starting to get accustomed to the “roller-coaster” ride that has become the wool market. The wild fluctuations are causing sellers a headache, deciding whether to sell, pass lots in, withdraw or wait.

We can only guess what this is doing to the exporters and processors, as they manage supply requirements alongside the unpredictable price movements of recent months. It is hard to imagine anyone is pleased with the recent volatility and it must be damaging the wool markets reputation internationally.

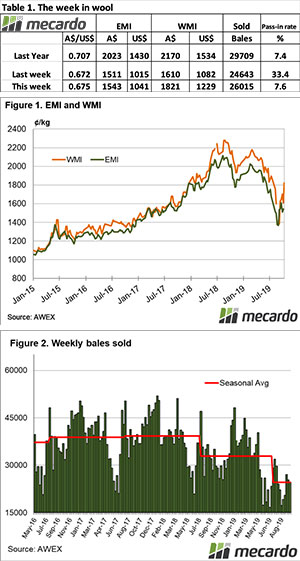
The Eastern Market Indicator (EMI) rose 32 cents or 2.1% (after losing 97 cents or 6% last week), to close at 1543 cents. The Au$ also rose to US $0.675. This saw the EMI in US$ also improve 26 cents to end the week at 1041 cents.

The Fremantle sales also fared well, with the Western Market Indicator recovering 43 cents of the  92 cents loss of last week to close at 1,653 cents. Again a small offering selling just 6,245 bales with a PI rate of 13.1%, modest compared to last weeks 40.8%.

Sellers reacted in what has become their normal response by “selling” into the rising market. The National Pass-in (PI) rate was 7.6%, compared to 33.4% of last week. AWEX reported that in response to last weeks big falls, growers withdrew large volumes prior to sale. For the week 4,620  bales were withdrawn.

A decreased offering of 28,149 bales came forward, with 26,015 bales cleared to the trade (Figure 2). There have been 116,533 fewer bales sold this season compared to the same period last year. This is an average weekly gap of 9711 bales.

As reported this week by Andrew Woods on Mecardo (view here), fine Merino prices have been under pressure from increased supply during the past 12-18 months, which has resulted in premiums shrinking to very low levels. As the fibre diameter approaches year earlier levels and then starts to increase, the supply of fine wool will steady and then begin to fall. This will reduce downward pressure on fine wool premiums. The reverse process, to a certain extent, will apply to broad Merino wool.

The dollar value for the week was $45.83 million, for a combined value so far this season of $512.71 million, and a bale average value $1,730.

While last week the Cardings indicators held against the tide, this week they were cheaper across the board, averaging a fall of 20 cents. The news from the Crossbreds types was that the 26-28 MPG’s improved, except for poorly prepared clips which were cheaper or were passed-in.

Next week an offering of 40,056 bales are rostered.

To continue to predict the market movements in this climate is a bit like following the formline of “The Wallabies”, you don’t know what you will get until the day. The long decline in wool export volumes should begin to play on processor inventories (assuming sales are continuing), so we will go for the market to continue on an improving trend for next week.

Delayed planting leads to delayed harvest.

It’s roughly four weeks until harvest starts in earnest. We will then truly get a good indication of how much the crop has fallen since the ABARES report in September due to frost and continued dryness. In the US, delays to harvest are causing concerns with Jack Frost on his way to their northern crops.

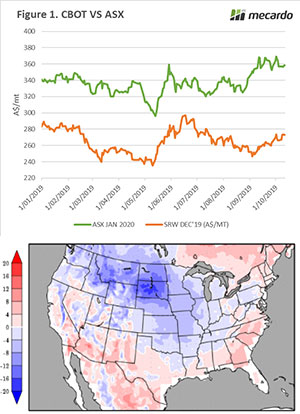
Over the past week, the ASX market has traded marginally higher (+A$1.5). The trading range has been narrower than the Moffat Star hotel (see link), with a range of A$356.50 to A$358.50.  We are only four weeks away from the bulk of harvesting commencing, and volatility is likely to return when the crop starts to get reaped.

Whilst ASX has largely flatlined, the December wheat contract has gained some ground. Week on week the contract is up A$6.
A plethora of trade analysts are expecting both the corn and wheat balance sheet to be trimmed in the overnight WASDE* report. This has resulted in gains this week, which are welcome news for producers. It must be noted that trade analysts also predicted bearish reports in July, August & September.

Another factor contributing to the improving pricing scenario for US futures (Corn, wheat and beans) is forecasts of poor weather (see map). Our regular readers will be aware of the poor planting conditions which lead to delays. The delayed planting is leading to delayed reaping, which with cold weather on the way is at risk of being damaged by frost (and snow).

*This week’s weekly comment was written prior to the release of the WASDE. My thoughts on the report will be included in the Commodity Conversation podcast.

Next week:

We expect that Australian production will be revised down from 19mmt to 18mmt, to reflect the poorer conditions since the start of September.

It will be interesting to see if there is any damage caused by this cold snap in the northern states, as this could provide the impetus for a further increase in overseas futures.

Do we need a long moratorium?

The Department of Agriculture is taking submissions until October 28th that will help determine the future regulation of the live sheep export trade, including the proposed moratorium during the northern hemisphere summer. 

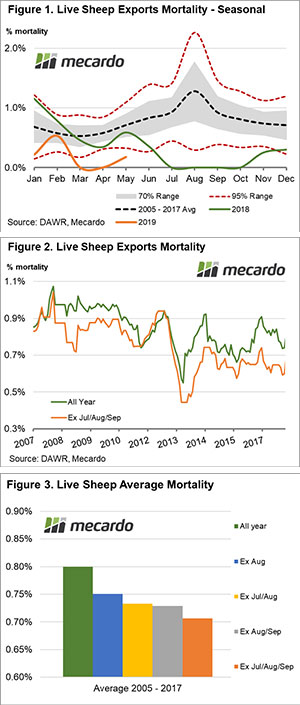
Analysis of seasonal live sheep mortality rates is presented in Figure 1. It shows the average monthly trend in mortality, the normal range (grey shaded zone) and an extreme boundary (upper and lower red dotted lines).

Traditionally the northern summer period (July to September) can see mortality peak. However, during the 2018 season the trade was suspended during this time resulting in no recorded mortalities from July to October. Interestingly, changes to shipping practices, such as reduced stocking densities, have seen much lower than average mortality rates outside the moratorium period for the later stages of 2018 and the first half of 2019.

Given that the usual peak in mortality occurs during the July to September period we assessed the impact on historic mortality rates for the 2005-2017 period if a moratorium had existed during these seasons.

Figure 2 highlights the rolling 12-month trend in mortality rates which shows the actual historic trend with the trade operating all year, unhindered (green line). Overlaid on the chart is the trend with July to September mortality rates excluded (orange line). Clearly, there is a reduction in mortality rates when the three-month moratorium exists. However, this moratorium comes at a cost to the viability of the industry, the supply chain and regional communities that rely on the trade.

To quantify the magnitude of the reduced mortality rates under the proposed moratorium, and to assess the potential impact of shorter moratorium periods we analysed the average long-term mortality figures based on a range of scenarios – Figure 3.

If you want to have your say on the impact of the moratorium make sure to submit a response to the Department of Agriculture discussion paper on the live sheep export trade here, before the 28th of October deadline.

What does it mean?

During the 2005 to 2017 period when the live sheep export trade operated without a moratorium the long-term average mortality rate was 0.80%, which equates to 400 sheep per shipment of 50,000 head.

Placing a moratorium only during August saw the long-term mortality rate decline to 0.75%, or 375 sheep out of a total of 50,000. A two-month moratorium, during July to August or August to September resulted in a 0.73% mortality rate, or 365 sheep. A three-month moratorium from July to September shows the mortality rate drop to 0.71%, which is the equivalent of 355 sheep out of a shipment of 50,000 head.

In terms of sheep survival, the difference between a one-month moratorium and a three-month moratorium is 20 sheep. The big question for our legislators is what is the cost of a three-month moratorium across the supply chain when you consider shearing teams of ten staff without work for a quarter of the year, small family business transport operators with 25% less work or feed suppliers with 30-40% less revenue?

Key points:

  • Changes to shipping practices during the 2018 season have seen live sheep export mortality rates reduce significantly, even accounting for the moratorium periods.
  • Long term average sheep mortality rates for the 2005-2017 period when no moratorium was in place were recorded at 0.80%, or 400 sheep out of a shipment of 50,000.
  • In terms of sheep survival, the difference between a one-month moratorium and a three-month moratorium is estimated at 20 sheep per 50,000 sent.