Tag: Articles

Big offering but market solid

After 8 weeks of consecutive rises in the wool market, producers responded with a large offering which resulted in a clearance to the trade of 44,800 bales.

The opening sales in Melbourne followed the weak finish in Fremantle last week. However, by the close on Thursday, it was a positive sentiment, with all centres posting gains on Thursday.

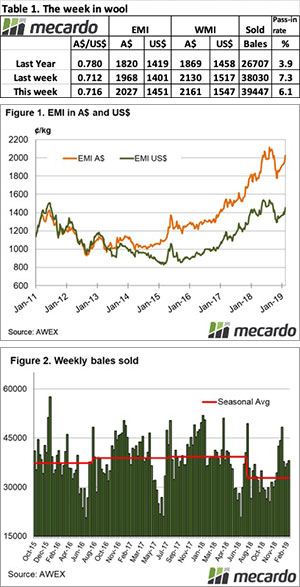
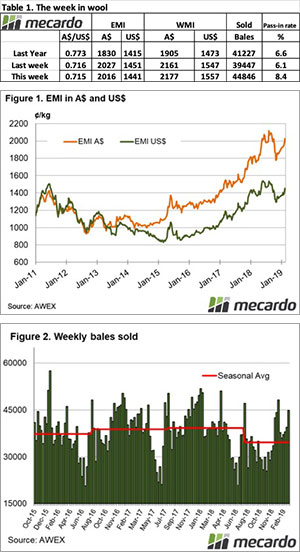
The Eastern Market Indicator (EMI) eased over the week, falling 11 cents by the end of the week to 2,016 cents. The Au$ was again slightly weaker also. The EMI in US$ terms was lower, down 10 cents to end the week at 1,441 US cents (Table 1).

In Fremantle, the Western Market Indicator (WMI) had corrected late last week, so this week it lifted a further 16 cents to end the week at 2177 cents. This is now the highest level since September2018.

48,948 bales were offered for sale this week, with the trade clearing 44,846. This is 5,400 bales more than last week, a sign of confidence from buyers and a signal that growers are pleased with these levels. Only 8.4% or 4,102 bales passed in.

In the auction weeks since the winter recess, 943,537 bales have been cleared to the trade, 190,651 fewer than the same period last year. The average shortfall cleared to the trade compared to the same time last year now sits at 7,061 bales per week fewer.

The dollar value for the week was an impressive $99.27 million, for a combined value of $2.24 billion so far this season. A simple calculation of $ value divided by bales sold gives us $2,215 per bale across all types.

Crossbred types were mixed, 28 & 30 MPG were cheaper of last weeks record levels, while 26 & 32 MPG’s were up 10 – 20 cents.

The week ahead

According to the AWEX roster, the next week is another solid offering of 46,000 bales predicted, a big increase on last weeks estimate. The roster then drops sharply with 38 & 37,000 bales rostered for the next two weeks.

The tightening supply on the horizon should see the market activity remain robust, at least for the foreseeable future.

Pricing resisting supply pressure, but maybe more to come

The higher prices last week brought more lambs forward, and as such the rally was stifled.  With supply still running strong, it seems to be a countdown until a sharp supply shift.

Here’s an interesting stat.  Combined east coast sheep and lamb slaughter has only been higher than our most recent data for one week out of the last three years.  Figure 1 shows that was back in November.  With copious supply, prices are holding up extremely well.

Figure 2 shows the Eastern States Trade Lamb Indicator (ESTLI) and the National Mutton Indicator, and both were relatively steady this week.  With no yarding data for this week yet, we have to go off the individual yardings.  In Victoria at least, sheep and lamb yardings were both higher, as grower’s responded to the better values of the previous week.

Over the hooks prices gained ground in Victoria this week.  Average trade lamb prices gained 12¢ in Victoria, moving back to 670¢/kg cwt.  It will still take some time to get lambs in however, with many processors reportedly booked out until April.

There has been plenty of talk this week about ordinary scanning rates in NSW.  This fits nicely with high sheep slaughter, with dry ewes going to market rather than being fed more.

The question is how long it can continue.  We didn’t think it could be stronger, but the sheep liquidation this year has outdone 2018.  Does this mean the supply correction is going to be earlier and stronger?  Probably, but no guarantees.

What does it mean/next week?:

There is no rain forecast for the next fortnight.  The Bureau of Meteorology (BOM) forecast for the next three months is not very compelling either.  Whether you believe the BOM three month outlooks or not, it suggests the correction in supply, and price upside might be nearer to last year’s than first thought.

A nasty turn around.

A fortnight ago the Bureau of Meteorology’s rainfall outlook wasn’t shaping up as too bad at least for the Southern parts of the country – how quickly it can all change. Yesterday’s release of the three-month outlook now points to a delayed Autumn break and much lower chance of rainfall exceeding the median across much of the Eastern half of the nation during March to May.

Cooler than average ocean temperatures to Australia’s west and south west have limited rainfall fronts crossing the country, leading to drier than usual conditions for all regions except for far north Queensland. A warming Pacific Ocean is keeping the prospect of an El Nino on the horizon and has seen the BOM forecast a drier than normal start to the Autumn break – Figure 1.

The bleak rainfall prospect and increased cattle yardings along the East coast conspired to see prices for younger store cattle and breeding stock ease this week with the Eastern Young Cattle Indicator (EYCI) falling 3.6% to its lowest level in over three years to close at 434¢/kg cwt yesterday.

Cattle throughput in the Eastern states lifting 14% on levels set the week prior to sit 5% above the five-year trend for this time in the season – Figure 2.

Young cattle in the East not the only cattle type to register a decline this week with the Medium Cow indicator leading the percentage price falls to see nearly a 5% drop to 175.9¢/kg lwt. Feeder Steers also easing slightly, down 1.4% to 250.4¢/kg lwt. Although, Trade, Medium and Heavy Steers beginning to show signs of supply concerns by posting 1%-6% price gains this week across the Eastern states – Figure 3.

In the West young cattle prices held their ground, registering only a 2¢ easing to remain above 500¢/kg cwt and in beef export markets the 90CL Frozen Cow indicator has held onto the 4% price gain from mid-February to close this week at 642.4¢/kg CIF.

Next week

The spread between the EYCI and 90CL is now approaching levels that would be considered extreme. The EYCI is at a 32% discount to the 90CL and the spread has only gone beyond a 39% discount for 5% of the time during the last two decades.

This is likely to see young cattle prices find a price base in the short term ahead of crucial support levels at the 400-420¢ region.

The bears are out for barley

It’s been a tough month for grain producers both locally and globally, with prices falling dramatically. In this weeks update, we take a look at the December futures contract, basis and potential issues with barley into China.

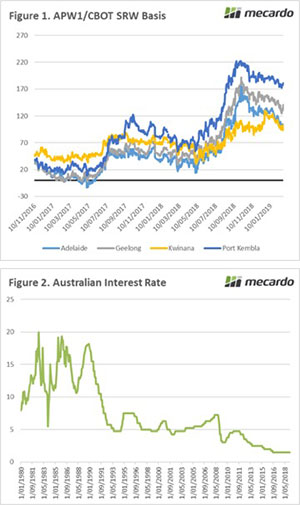
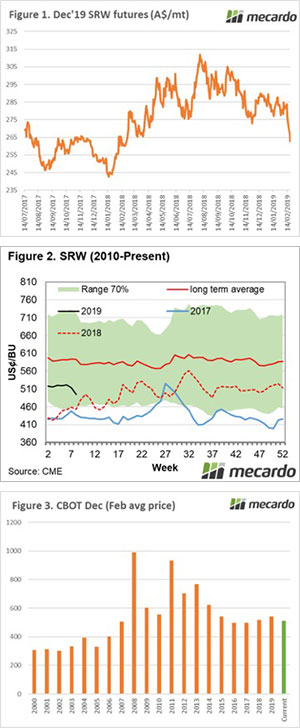
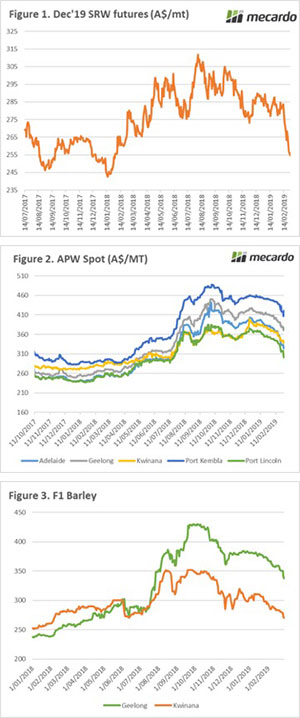
The futures market has another tough week, with spot futures falling 6% since last Friday to end the month down 13%. In A$ terms wheat futures have retreated A$30/mt. The December wheat contract which coincides with our harvest has fallen to A$254 (figure 1), the lowest since early February last year.

The highest price since the contract commenced was achieved in August at A$311, this would have provided a strong base for marketing the coming crop, with basis yet to be added to your overall price. The current market structure is starting to provide improved opportunities for consumers to hedge their requirements for the coming year.

At present basis is largely unchanged since the start of the month, which has meant that most port prices have followed the futures fall by A$30. The exception seems to be in South Australia, with basis falling A$24 in Adelaide and A$19 in Port Lincoln. This has resulted in price falls across the board (figure 2), obviously exacerbated in South Australia due to substantial difference in basis.

The barley market is in a precarious situation at present, with prices falling (figure 3) due to risk concerns related to China. It is likely that the conclusion of the anti-competitive dumping investigation will be released imminently.

Through conversations with a number of industry contacts, the general consensus is that it will be negative towards Australia.  The expectations are that a deposit of 55-60% of the value of any vessel importing barley ex Australia into China. The Chinese government will review the import and then return the deposit, provided there are no issues.

At present this is merely rumors and the result could feasibly go the other way, however at present the risk in selling barley into China is high, which limits the appetite of exporters.

As a side note, it was reported that China has bought eight cargoes of barley ex Ukraine in the past week. Is this a portent of things to come, with them buying barley ahead of an announcement?

What does it mean/next week?:

The wheat market has fallen substantially in the past month, will we see short speculator start to profit take? The commitment of traders report is only just starting to get back up to date and it will be interesting to see how far short the market is.

China is going to be the big story over the next few days, not just for Australia but also the long-awaited results of discussions re US trade tariffs.

January records smashed for lamb exports

Department of Agriculture and Water Resources (DAWR) trade statistics for January show a 15.6% year on year increase in lamb exports and the gains in mutton export flows aren’t far behind, up 15% on January 2018. Despite posting similar volume gains, a breakdown of key destinations for the lamb and mutton export trade shows that the growth in demand is being driven from different regions.

Total lamb exports from Australia were reported at 21,541 tonnes swt, the highest January volume on record and coming in 21.4% higher than the five-year seasonal average for January – Figure 1. The January 2019 lamb export volumes were 15.6% above the 2018 level, boosted by record flows to the Middle East and the USA.

Australian lamb product to the Middle East totaled 6,487 tonnes swt, the highest January total on record, 25% up on January 2018 and 36% higher than the five-year average trend. Even stronger percentage gains were noted for the USA with the January 2019 lamb export volume of 5,593 tonnes swt also posting the highest January figure on record, increasing by 35% on January 2018 levels and 38% above the five-year average for January.

Mutton exports out of Australia for January 2019 show a similar lift in volumes, increasing 15% year on year to 15,485 tonnes swt – Figure 2. However, the significantly above average volumes for mutton during January were limited to Asian destinations, namely China, Singapore and Taiwan, to see the January flows sit 13.7% above the January five-year average.

Growth in mutton flows from Australia to China were up 18% year on year for January to see 4,805 tonnes swt consigned, the second highest volume for January and just a fraction short of the record 4,822 tonnes sent during January 2014 – Figure 3.

What does it mean/next week?

Last week we reported on strong beef export numbers for the start of 2019, fueled by growing Chinese demand, to see China overtake South Korea as the third top destination for Australian beef exports.

Perhaps the issues faced in China currently regarding African Swine Fever (ASF) and the reports of nearly one million pigs being culled due to the contagion are beginning to flow through to additional demand for alternative proteins, such as beef and mutton. It is early days yet, but it will be worthwhile to keep track of the ASF developments in China as the season progresses to determine what impact, if any, it is having on our export markets.

Key points:

  • Lamb exports recorded the highest January monthly total on record coming in 21.4% above the January seasonal five-year average at 21,541 tonnes swt.
  • Lamb consignments to the Middle East and USA underpinned the strong January results, with both destinations registering record January flows.
  • January mutton exports were supported by Asian demand growth, coming in 13.7% higher than the five-year average for January at 15,485 tonnes swt.

Sausages, coal and interest rates

The grain market is not only steered by agricultural factors, many of the driving forces behind price movements are out with the industry. In this weeks grain comment we look at how sausages, coal and interest rates can have an impact on our industry.

In yesterday’s grain analysis “Don’t get caught in the basis bubble”, I discussed the issues around overseas values plummeting. Overnight there was a small correction, albeit remaining very close to contract lows.

In figure 1, the APW1/CBOT basis is displayed from 2016 to present. As we can see our premium over Chicago increased dramatically during the second half of last year as drought bit hard. These level smashed all prior records.

As we can see, the basis level has dropped dramatically in the post-harvest period. If we get an average harvest the basis level will converge back with new crop pricing; at a level closer to historical ranges. The basis has saved our pricing, but there is limited chance of these levels being around during harvest (unless we have a drought).

Nationals senator Barry O’Sullivan, caused uproar in China with comments related to biosecurity:

there’s a bigger chance of us having a biosecurity breach by some bloody old Chinaman who brings in his favourite sausage down the front of his undies

It’s clearly not a great idea to insult the countries most important trading partner. There are rumors that this comment and festering tensions could lead to barley being impacted with an anti-dumping tariff in the coming month.

It is reported that the port of Dalian has banned imports of Australian coal which could be a symptom of deteriorating trade relations. The A$ dollar was under some pressure as the market digested the information. At present Dalian only receives <2% of Australian coal exports, however coal exports remain Australia’s most valuable export, and contagion to other ports would have a dramatic negative impact on the economy.

In 2018 it was widely expected that rate rises would commence in 2019. There are now forecasts of not one but two interest rate cuts in 2019. These two cuts (predicted at 0.25%) will reduce interest rates to 1%. The current record low rate of 1.5% has been held since August 2016 (figure 2).

A reduction in interest rates will lead to a fall in the A$ which will benefit exports but will increase the cost of our import requirements. If the rates are passed on, it will provide cheap money for investment purposes.

What does it mean/next week?:

The world looks towards the northern hemisphere weather. At present conditions are good, and in places excellent.

However there is still ample time for disasters to occur.

Signs of tightening supply

A nice lift in prices across the board for all NLRS reported categories of lamb and sheep along the East coast this week, as saleyard throughput figures suggest supply is on the wane. The Eastern States Trade Lamb Indicator (ESTLI) gaining over 3% to close at 665¢/kg cwt.

Prices lifted between 1-6% on the week, with Restocker Lamb the worst performer of the bunch managing a meagre 5¢ lift to close at 646¢ (Figure 1). In contrast, East coast mutton was the standout jumping 6.4% to finish the week at 415¢/kg cwt.

East coast lamb yarding levels provide a clue to the current price behaviour. Throughput has eased 27% from the week prior to see the 2019 trend dip below the normal range for the first time this season with less than 135,000 reported through the saleyard last week. Indeed, since the start of the year average weekly lamb throughput levels have been running 14% below the five-year trend (Figure 2).

East coast sheep yardings posted a dive of a similar magnitude too, registering a 29% drop week on week. Despite the reduced sheep numbers, weekly levels remain just within the normal range at around 75,000 head as above average weekly NSW sheep throughput stems the broader east coast decline in sheep numbers (Figure 3).

Since the start of 2019, average weekly sheep throughput in NSW has been running 14.5% above the five-year average level. In contrast, Victorian sheep yarding levels have been trending 9% below the five-year average, while South Australian sheep throughput has been 20% softer than the seasonal average.

Next week:

There is nothing of note in terms of rainfall on the BOM weekly forecast for sheep and lamb rearing regions, but the dwindling supply is probably enough to keep prices sustained as we head toward Autumn.

Don’t get caught in the basis bubble.

Shocking production brings sensational prices. During the past six months grain producers have been dejected by production or elated by prices. As we move into seeding it is important to understand that Australian prices are held up by a bubble of basis. Will the bubble burst?

Australian wheat prices in all zones are at very attractive levels. It is important not to be too distracted by these prices as we move into the new growing season. Our prices in a typical year are dominated by the export market, this year domestic deficits ruled the state of play.

The most important factor to remember in marketing in grain is basis. This is not a complicated term, it is merely the difference (premium or discount) between two pricing points. In most discussions around wheat we refence basis between the physical and Chicago futures price. However, it could just as easily be the basis between our price and London feed wheat futures.

The reason I used the term bubble in this article, is that the basis levels currently experienced will only be maintained if we see major production issues in the coming season. If we receive an average to above average crop, our prices will again be weighted towards exports.

Therefore, it is extremely important to look at both local and overseas levels, especially as we move closer into the planting window.

The futures market has received a beating during the past week with spot futures back 8% since the start of the month. This equates to A$19, a considerable fall in anyone’s books (figure 1). At a seasonal point of view the market is largely following the expected trend albeit more sharply than normal (figure 2).

In figure 3, the average February price for the following December is displayed, along with the current price (green bar). At present the current average for February is highest since 2014, however with another week to go, we could see this slip further.

So why are global prices falling?

  • Demand from North Africa is declining
  • US wheat is uncompetitive versus other origins (Argentina & Russia)
  • Initial reports are positive for the coming crop in a number of origins

What does it mean/next week?:

It’s not all doom and gloom yet, there is still a long way to go between now and harvest. However, it is vitally important to understand the risk in the market.

Currently Australian producers can extract very strong prices as a virtue of our domestic deficit on the east coast.

These premiums over international values will not be sustained if we have a reasonable crop next season. Therefore, our prices will have to reduce to meet international demand, if we see global values fall, our levels will come in line.

At present producers on the east coast are able to access the ASX Jan 2020 contract at A$335, a basis level of A$72.

Key Points

  • Basis levels in Australia are at historically high levels.
  • Overseas values are under pressure.
  • The basis levels experienced in Australia at present will not persist unless there is a 2nd disastrous year.

Market pays no heed to supply warnings

With everything pointing towards lower cattle supply, and grain prices on the wane, we would think the market should start taking heed at some stage. It was not this week though, with the downward trend in cattle prices extended.

Figure 1 gives a fair idea as to why cattle prices continue to fall. It has been four years since east coast cattle slaughter has been this strong at this time of year and it’s running 10% ahead of this time last year.

Interestingly, heavy slaughter cattle prices are not that far below last year. The National Trade Steer is 19¢ below the same time last year, but Heavy Steers are 2¢ better (Figure 2). Restockers and Feeders are dragging the chain, and the Eastern Young Cattle Indicator (EYCI) is now 72¢ off last years levels, at 449.5¢/kg cwt. The EYCI hasn’t been below 450¢ since April 2015 so looks like good buying.

Helping support finished cattle prices are rising 90CL export values. This week the price in US terms gained 6.5¢, while in our terms it was up 25¢. Figure 3 shows the increase in export values is nearing a 3 year high. In US terms the 90CL is heading towards a 10 month high.

It’s not surprising given the cheaper grain and better season, but the Western Young Cattle Indicator remains at a premium to its east coast counterpart. The WYCI is at 493¢/kg cwt, but well behind over the hooks prices. The WA MSA Steer is the most expensive in the country at 580¢/kg cwt, 40¢ ahead of this time last year.

What does it mean/next week?:

There’s no rain on the forecast and as such, it’s hard to see too much of a price rise on the cards.  However, the closer we get to an autumn break, assuming it’s coming, the closer we are to a rally.  The key to picking the market will be buying before the rain hits, which as we know from the ongoing dry, is not as easy as it sounds.

Wool market Springboks past 2,000 cent mark

If we were to think of what “black swan” events might impact the wool market in 2019, Foot and Mouth Disease (FMD) outbreak in South Africa (SA) would not have been high on the list.

This, however, has been the case as this week China decided to bypass SA wool auctions, leading to Cape Wools SA deciding to suspend wool sales this week.

This decision was on the back of an outbreak of FMD identified in January in the Vhembe district in Limpopo.

The Eastern Market Indicator (EMI) surged on opening in Melbourne on Monday, gaining 59 cents by the end of the week to 2,027 cents. The last time it settled above 2,000 cents was in October 2018. The Au$ was again slightly stronger up 0.57%. This resulted in the EMI in US$ terms was also dearer, up 50 cents to end the week at 1,451 US cents (Table 1).

In Fremantle, the Western Market Indicator (WMI) was also pumped by the events across the Indian Ocean, rising 31 cents to end the week at 2161 cents. This is also the highest level since October 2018.

42,029 bales were offered for sale this week, with the trade clearing 39,447. Again, growers were impressed with the market and passed in only 6.1% or 2,582 bales.

The dollar value for the week was $83.56 million, for a combined value of $2.14 billion so far this season.

In the auction weeks since the winter recess, 975,539 bales have been cleared to the trade.

All types benefited from the strong market, however later in the week there was evidence that buyers may have been over exuberant and markets retreated from the peaks of Wednesday.

The week ahead

According to the AWEX roster, the next week 49,738 bales are predicted, with a designated Australian superfine sale in Sydney. This is a significant jump up from volumes rostered last week as strong prices are enticing sellers to come forward. 38,813 and 36,460 bales are rostered for the next two weeks.

While it is disappointing for our wool producer friends in South Africa, the continued uncertainty around China’s intentions should see our market at least sustained at these levels in coming weeks.