Key points:
- The broad price trend for F1 Wagyu steers and heifers mirrors the EYCI movements, with a moderately strong correlation between the two price series present.
- The average premium spread for F1 Wagyu over EYCI cattle since mid-2015 has been 83%.
- F1 Wagyu prices have spent most of the time trading 75-95% higher than the EYCI over the last few years.
 As it is international Star Wars day (May the fourth be with you) and the Australian Wagyu Association’s conference being held in Albury this week we couldn’t resist both the pun and the focus on Wagyu premiums over comparable young cattle, based off the Eastern Young Cattle Indicator (EYCI) underlying data.
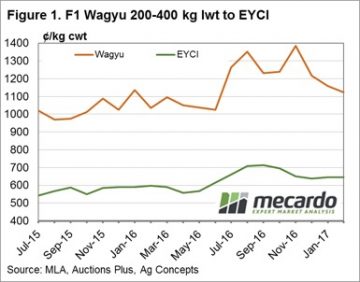
Figure 1 outlines the average monthly price for F1 Wagyu Steer and Heifers** weighing between 200-400kg lwt, according to AuctionsPlus data since July 2015, to comparable young cattle using the average monthly Eastern Young Cattle Indicator (EYCI) level. The price movements show a reasonably similar movement over time between the two series with the Wagyu F1 cattle, understandably, commanding a healthy premium over the EYCI.
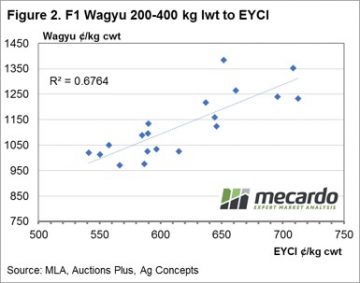
While figure 1 shows the broad directional movements of the EYCI mirrored in the Wagyu price pattern an analysis of the correlations between the two price series shows a moderately strong positive relationship displaying an R squared of 0.67 – figure 2 (you can find a handy explanation of the R squared measure here). Essentially, this means that F1 Wagyu prices and the EYCI can be expected to move up and down in unison, more often than not.
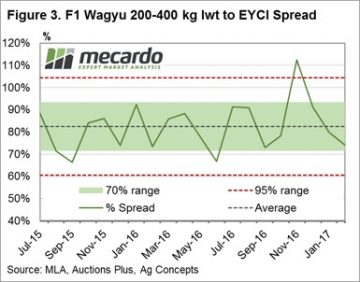
 An analysis of the percentage spread that has been achieved by F1 Wagyu cattle within the same weight range of EYCI cattle shows an average premium of 83% has been attained since July of 2015 – figure 3. Although the percentage spread can vary at any given time the 70% range between a premium spread of 72%-94% (green band) highlights where the series has fluctuated for 70% of the time. The two red dotted lines between 61% to 104% give an indication of the 95% range (two standard deviations away from the average for the statistically minded reader) and gives an indication of when the spread is nearing historically extreme levels.
**The first cross of a Wagyu full blood 100% bull over another breed is referred to as an F1.
What does this mean?
 On average, the F1 Wagyu producer can expect to receive a premium spread between 75-95% above the EYCI most of the time. Recent discussions with Wagyu F1 producers indicated that forward basis agreements had been under negotiation with processors to determine an EYCI plus an agreed percentage spread as a settlement price when cattle were due for delivery. This historical spread analysis will give an idea of what type of premium for F1 Wagyu cattle above the EYCI is within a fair and reasonable range.
 As pointed out in
 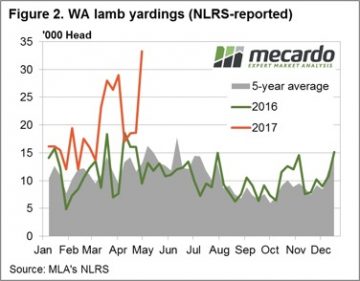 A different story in the West though with solid prices enough to draw out supply as the pattern of lamb yarding in WA shows so far this season tracking well above the five-year average pattern and the 2016 trend – figure 2. Prices in the West responding in an anticipated to the 78% jump in lamb yardings on the week, fashion according to the laws of economics, with the WA Trade Lamb Indicator (WATLI) down 7.5% to 596¢/kg cwt. The elevated east coast lamb yardings having an impact on the Eastern States Trade Lamb Indicator (ESTLI) too, albeit to a lesser degree than out West, with a slight fall of 1.7% recorded on the week to see it close yesterday at 634¢/kg cwt.
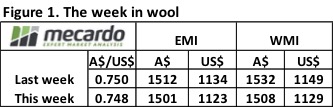
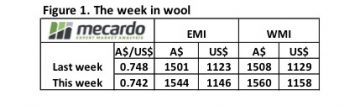 A solid two days trading as exporters re-entered the market this week to see both the Eastern and Western Market Indicators sitting comfortably above 1500¢. The EMI closing the week at 1544¢, a gain of 43¢, and the WMI slightly firmer at 1560¢, up 52¢.
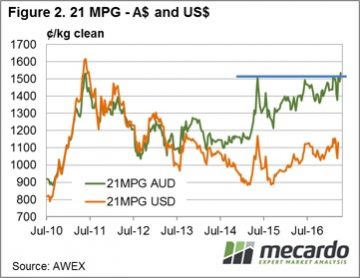 Historically the 21 micron class has struggled to hold above 1500¢ for any decent length of time but recently this resistance level has continued to be probed – figure 2. Brokers indicate that there is plenty of space in the wool stores at the moment, so supply remains an ongoing issue. This factor, combined with a continuing softening A$, sets the tone for the chance for further upside in the coming weeks. Clearly, as the chart shows in USD terms overseas buyers have paid higher levels for 21-micron wool in the recent past, so there is the capacity for them to still bid local prices higher.
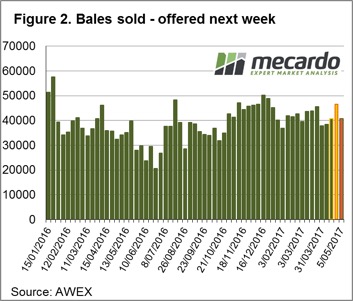
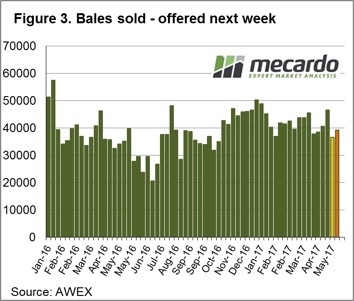 Offerings over the next few weeks continue to decline, with all of the next three sale weeks listing bales offered under 40,000. Week 45 is operating in all trading centres on Wednesday and Thursday and has 39,253 bales listed. Weeks 46 and 47 will see supply tighten further with 36,100 and 37,650 bales offered, respectively.
 (2.6bn mt) for 2016/17, and old crop end stocks will largely cancel out lower production in the 2017/18 season. Our view still remains the same that a large supply shock is required to put fire under wheat prices to an excitable level.
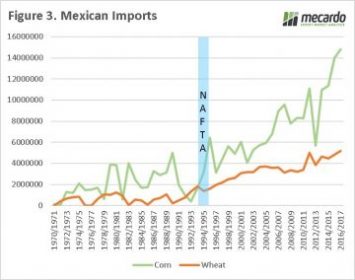 ready to scrap the North America free trade agreement (NAFTA), however it was later announced that there would a ‘renegotiation’. Free trade agreements were at the centre of Trumps campaign, with fears that they negatively impacted on American jobs. The removal of NAFTA would be a worry for American grain growers, as trade with Mexico has drastically increased since 1994 when it was enacted (figure 3). The overwhelming majority of imports are from the US but in recent months it is speculated that Mexican buyers have been examining options from the South (Argentina & Brazil).
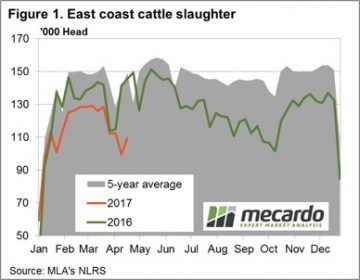 Figure 1 shows the seasonal pattern for East coast slaughter for the week ending 21st April. While the numbers don’t yet represent the shortened ANZAC week it is still clear to see the recovery in supply after the Easter dip. East coast slaughter for the week rising to 109,500 head, a 10% increase from the previous release.
 A forecast for some light rainfall for parts of Queensland and Victoria over the next week shouldn’t be enough to hamper transport so supply of cattle should continue to improve post Easter. Meanwhile, reduced beef cold storage levels for April in the US as they head into their “grilling season” should see the beef export prices supported in the coming weeks and will provide some encouragement to local processors on any price dips. These two factors set the stage for some price consolidation around the 650¢ level for the EYCI in the short term.
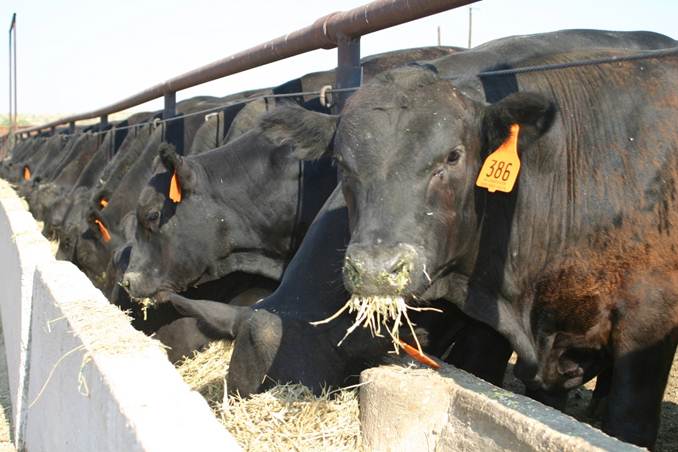
 During a favourable season optimism runs high among restockers and opportunistic cattle traders supporting demand and prices for store/young cattle. The added buying competition between the three main purchasing groups (restockers, lot feeders and processors) will often see the Eastern Young Cattle Indicator (EYCI) outperform the price patterns for finished lines, as there is really only one buyer type for fat cattle – the processor. This piece will take a look at what can be expected for the spread pattern between heavy steers and the EYCI along the East coast for the next six months.
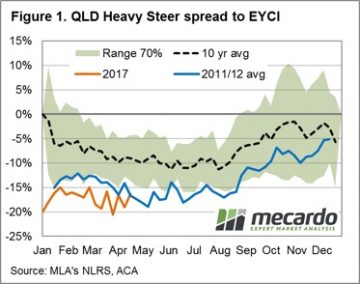
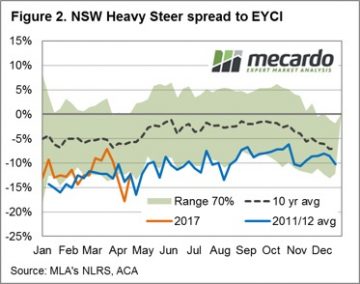 Interestingly, so far for the 2017 season the spread pattern in all three states has been following a similar trajectory to the 2011/12 average pattern. In addition, each state’s spread pattern for this season is trending close to the lower end of the 70% banding, reflecting that the favourable conditions have supported young cattle prices more than the price for finished cattle. Perhaps somewhat unsurprisingly the state that was hit hardest by the most recent cattle turnoff, Queensland, is experiencing the widest spread between young and finished cattle as the requirement to rebuild the herd is likely to be most evident in that region.
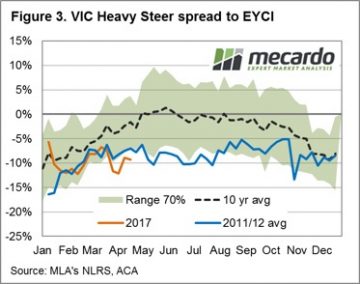 It is likely the spread patterns for each state will continue to trek along the lower end of the 70% band for much of the second half of the year. However, as the confidence level on longer term climate predictions for the 2018 season grows into the later stages of 2017 spreads may begin to return to more normal levels, particularly if the transition from a wetter to drier climate cycle becomes more evident.
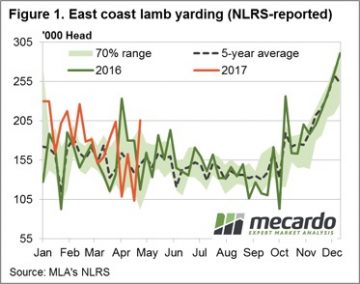
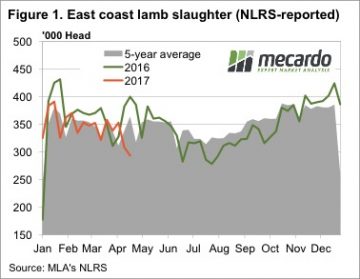 One of the most interesting numbers found this week was MLA’s weekly lamb slaughter for the week ending the 21st of April. Lamb slaughter came in at just 293,342 head, the lowest level since July last year. In the week ending the 21st Lamb slaughter fell 5%, and also sat 5% below the Easter levels of 2016.
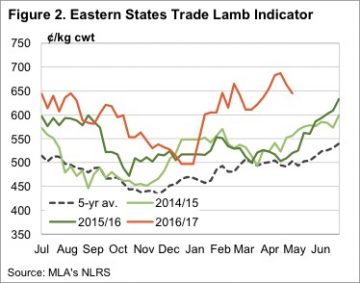 Not all lamb prices fell this week, Merino lambs gained 19¢ on the east coast, while light lambs were up 12¢. Neither quite managed to hit record highs, but are not far off at 611¢ and 673¢/kg cwt for Merino and Light lambs respectively.
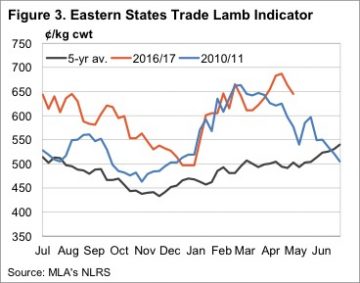

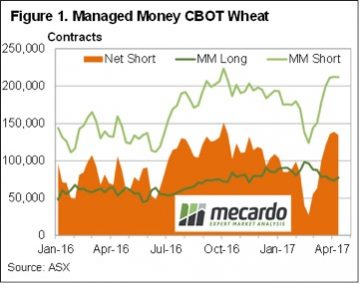 Earlier this week we took a look at some of the production data US wheat markets take note of, and there is also some data which shows how traders react. The CFTC Traders Summary tells us what type of trader holds long or short positions in CBOT wheat.
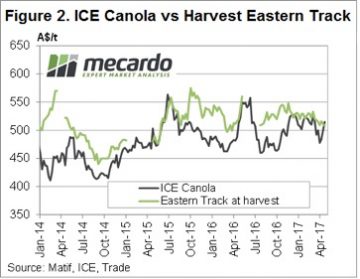 Canola has found some strength in Canada this week as wet weather delays sowing. The spot ICE contract rallied over $30 to $520/t, while Jan-18 gained $15 to sit at $497/t today. With the weather forecast not looking favourable for sowing, there could be some more upside for Canola.
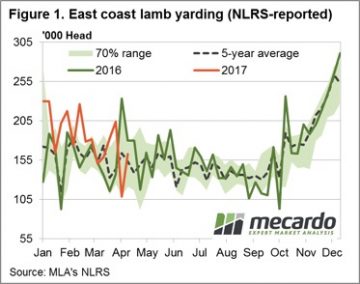 A rebound in East coast yardings post the Easter break, particularly out of NSW, sees the Eastern States Trade Lamb Indicator (ESTLI) take a breather this week. The ESTLI posting a 2.9% drop to 667¢/kg cwt. Not so for National Mutton, bucking the trend with a 1.9% gain to 495¢ – dragged higher by gains to Western Australian sheep.
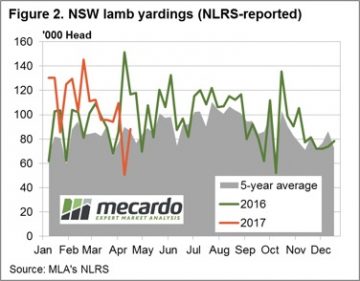 Despite the higher supply, restocker lambs in NSW and Victoria gaining some ground up 10.4% and 6.6%, respectively. NSW restockers now fetching $119 per head, while Victorian restockers are enjoying a $126 per head level. The higher NSW yardings having most impact on Heavy and Trade lambs in that state down 4.2% (641¢/kg) and 1.4% (656¢/kg), correspondingly. The two softest categories of Victorian lamb for the week were Merino, falling 5.2% to 616¢, and Light lambs, down 3.5% to 660¢. Trade lambs the star performer in SA, the only category of sheep in that state to post a gain this week, up 4.2% to 614¢.
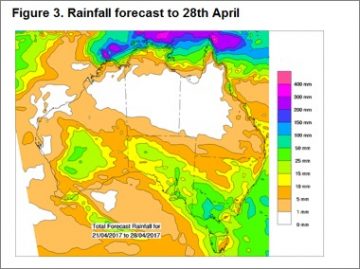 Another short week ahead with the ANZAC break and some decent rainfall to much of the sheep regions of the nation (figure 3) should see prices hold, or perhaps firm slightly. As outlined in the sheep/lamb analysis piece this week longer term fundamentals will continue to support any price dips seen in sheep and lamb markets for much of the current season.