Month: June 2018

CBOT up as a start to the season appears

Chicago Soft Red Wheat managed to maintain its upward trend this week. It had an attempt at moving lower but bounced stronger on Wednesday night. Local wheat prices also tried to go lower but found strength on Thursday.

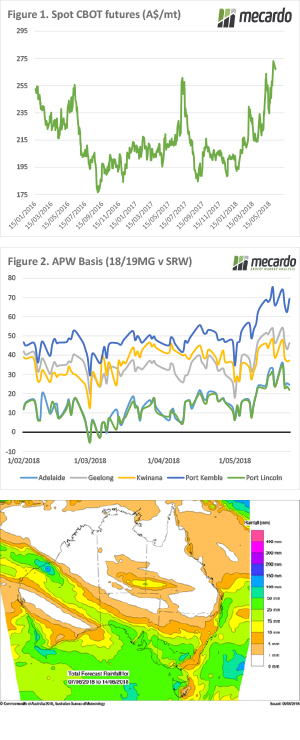
Figure 1 shows CBOT wheat in AUD/t sitting just below the highs hit at the end of May. Still, $267/t is close to the best swap price we have seen for the December contract since 2015. The market did move a little lower earlier in the week before recovering. Apparently there was some speculator profit-taking triggered by the higher levels, and the Aussie dollar found some strength this week.

The AUD is actually back at 76.5US¢, its highest level in six weeks thanks to some stronger economic data.

Locally wheat prices followed CBOT’s trend, finishing the week on a high. While new crop APW basis in the Newcastle zone is at around $100/t basis, in the south it’s close to $50/t (Figure 2). If crop prospects continue to weaken Geelong basis could rally to $80-100/t as well, so at $320/t it could end up being cheap.

Old crop markets continue to tighten, with any remaining grain being held tight, and buyers having to pump up prices to get hold of it. A good rain and some grass growth might take some of the pressure off demand, but supply relief won’t turn up until the new crop arrives; if it does at all.

The week ahead

Figure 3 shows some good rain forecast for Victoria and southern NSW this week. In fact, most of the Mallee, parts of the Riverina and SA are expected to get their monthly average rainfall over the coming 8 days. This will give crops a start, but with no subsoil moisture, follow up will be required before the heat comes out of markets.

Another two year slaughter high but prices rise

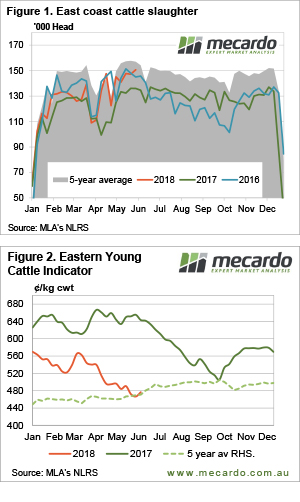
Another week and another high for slaughter rates. It seems, however, supply may have eased a little this week, as the Eastern Young Cattle Indicator managed to gain ground for the first time in a month and posted its biggest gain since March.

Figure 1 shows cattle slaughter ramped up again in the week ending Friday the 1st of June. It was in May 2016 when east coast cattle slaughter was last over 150,000 head. Last week slaughter didn’t quite eclipse the 2016 level but was the second highest weekly slaughter since the end of 2015.

Queensland slaughter was relatively steady last week. It was NSW and Victoria where rates jumped, as winter arrived with no real precipitation.

This week the EYCI gained 10¢, which is its best effort since March, to finish Thursday at 476.5¢/kg cwt.  The market will have to gain another 20¢ before we can say the downward trend has been broken.

We might be starting to see the winter doldrums for young cattle supply. The 15,000 head young cattle yarding this week was the second lowest for a full week for the year.

Most of the state indicators were steady to slightly higher this week. One number which caught our eye was restocker steers in SA at 50¢/kg lwt. Hopefully, this was a typo.

In the west, young cattle prices eased, with the WYCI down 11¢ to 532¢/kg cwt. It rained in the west during the week, so at this time of year prices probably shouldn’t be falling. They might bounce back this week.

The week ahead

There looks to be some rain on the way for the Riverina, which might offer a start to the season if it’s followed up within a couple of weeks. This might at least halt some of the supply of young cattle as grower elect to take a wait and see approach.

Southern WA is set to get some more rain, so it’s hard to see prices dropping much further over there as supply is traditionally tight at this time of year and rain will only make it tighter.

And so, it begins…

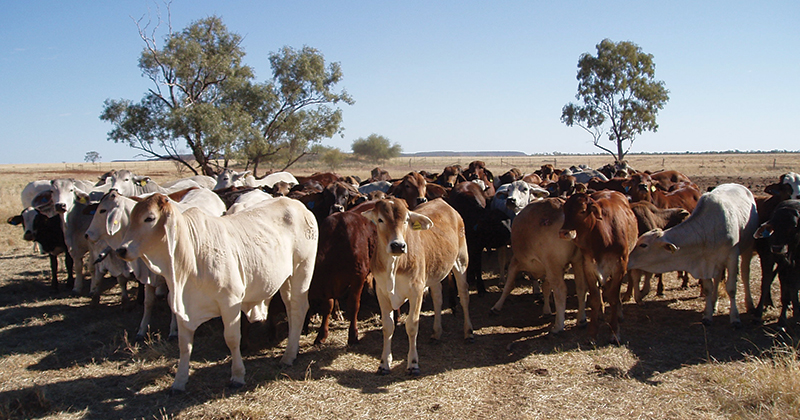
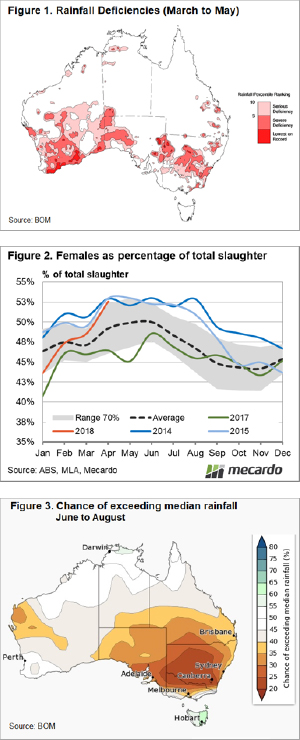
The most recent update to the ABS cattle slaughter data shows a jump in the ratio of female cattle slaughtered as a proportion of the total kill. The average annual ratio now sits at 48% signifying that we are technically in a herd destocking phase.

The rainfall deficiencies map for the last three months provides an insight into the driving force behind the increased cull ratio of female cattle with severe deficiencies impacting producers in much of NSW and Southern WA – Figure 1.

Average monthly ABS cattle slaughter figures for the first quarter of 2018 sit 10% below the five-year first quarter pattern. However, the five-year average figure is somewhat distorted by the very high turnoff experienced between the very dry 2014 and 2015 seasons – which was in excess of 9 million head per annum.

An assessment of the five-year first quarter average slaughter levels with the 2014 and 2015 seasons removed shows that the current slaughter levels for the first quarter of 2018 are right on average, at around 1.77 million head per quarter.

While the total cattle slaughter numbers are not unusually high, there has been a noticeable change in the types of cattle being sent to meatworks in recent months. As shown in Figure 2, the ratio of females slaughtered as a proportion of the total kill has increased significantly since the start of the season.

Indeed, the female slaughter ratio has gone from the lower end of the normal range in January at 43.5% to the upper end of the seasonal range in April at 52.6%. The April female slaughter ratio is now nearer to levels experienced during the 2014 and 2015 seasons herd liquidation phase, which peaked at 53% during the winter of these years.

What does it mean?  

The surge in the percentage of females slaughtered as a proportion of the total kill in recent months has lifted the annual female slaughter ratio to 48% for the 2018 season. A female slaughter ratio above 47% is generally considered to be reflective of a herd liquidation phase.

During 2014 and 2015 the average female slaughter ratio from January to April was 50.6% and 50.3% respectively, compared to 48% for the current season. This suggests the liquidation experienced so far this year hasn’t been as pronounced as the 2014/15 phase.

However, the three-month rainfall outlook for winter released by the Bureau of Meteorology last week (Figure 3) points to a much drier than normal period ahead so it is difficult to see the female slaughter ratio backing off too much in the coming months.

Prospect of rain brings a price gain

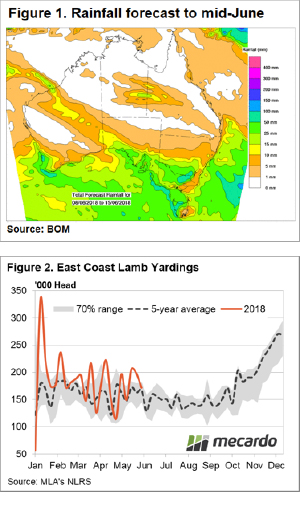
For the first time in a while, there is the prospect of 25-50 mm of rainfall into parts of southern NSW desperate for some relief. Falls are expected to extend into South Australia and Victoria and this has encouraged a drop in lamb throughput levels this week from the elevated trend we have seen during May, in turn providing a boost to lamb prices.

Table 1 highlights the sale yard price movements across the east coast, with gains between 2-6% noted for all categories. East coast Restocker Lambs are benefiting most from the wet forecast with a 6.1% lift to see it back above 600¢. The Eastern States Trade Lamb Indicator (ESTLI), not quite as robust a performance but still a respectable 2.7% lift to close at 636¢/kg cwt.

Figure 1 outlines the Bureau of Meteorology’s forecast for the coming week in terms of rainfall and although a long way yet from satisfying the parched areas of NSW, it’s a welcome relief. Lighter falls of up to 10 mm are expected to extend to northern NSW but the bulk of the rain will centre upon Victoria and the southern regions of NSW and South Australia.

The wetter outlook seems to have weighed on east coast lamb throughput this week which staged a 13% decline (Figure 2). This brings lamb throughput back in line with the seasonal average levels for this time of year and is 8% softer than for the same week last season. East coast lamb yardings are now back to more normal seasonal levels after spending much of May above the usual range.

In contrast, east coast mutton throughput remains elevated, underpinned by persistently high NSW mutton yarding levels. Indeed, NSW mutton throughput currently sits 105% over the seasonal average for this time in the year with over 63,000 head changing hands this week at NSW sale yards.

What does it mean/next week?:

The rain due this week should continue to provide support to lamb and sheep prices in the short term. The prospect of supply beginning to tighten as we head further into winter should keep prices fairly robust into the coming few months.

An end to the winning streak for some but not all

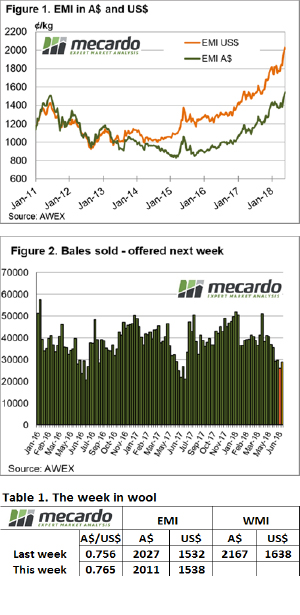
For the last month the wool market has gone from strength to strength, but alas, the upwards stream has come to a halt. That is, unless you look from a US$ perspective. Despite the small offering due to no sales in Fremantle, most categories retracted from the outset on Tuesday.

In Australian dollar terms the Eastern Market Indicator (EMI) pulled back 16 cents on the week to close at 2,011 cents. The news wasn’t all bad though, the Aussie dollar lifted back above US$0.766 during the week on the back of strong GDP data to trade at a six-week high. This lent to the EMI in US$ terms lifting 14 cents to hit a new record of 1,547 cents on Wednesday, only to retract back 6 cents to 1,538 cents on close (Figure 1).

26,942 bales were offered to the trade this week from the two sale centres. This was the smallest offering that we have seen this season. 3.6% of the offering was passed-in, meaning 25,973 bales were cleared to the trade.

Finer microns experienced the largest losses in the falling market. 17 to 19 micron wools were down on average 40-50 cents in both Sydney and Melbourne. AWEX reported that 21 micron and coarser wool attracted very strong demand. As a result, medium fibres saw negligible drops to 15 cent gains across the market.

Most crossbred categories experienced slight corrections of up to 15 cents. Merino skirtings were not exempt from this week’s losses, generally declining 20 to 40 cents.

Unlike previous weeks, buyers weren’t willing to stand for poorly prepared lines. Discounts were received on lower style and spec lines.

Cardings were in short supply and managed to hold onto last week’s prices.

The week ahead

Next week we are back to a full roster with sales in Sydney, Melbourne and Fremantle. 28,956 bales are expected for week 50 of the selling season (Figure 2).

Volatility in the US not impacting here -yet

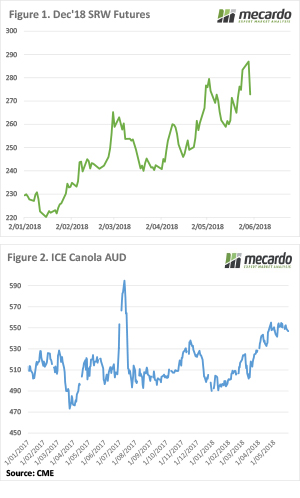
The wheat yo-yo continued in the US as they approach harvest. Chicago Soft Red Wheat rallied to new highs this week, before easing back again. The charts are pointing to more upside, but supply will soon start rolling in.

It was all up for CBOT wheat late last week, but after the long weekend in the States, some profit taking and pre-harvest grower selling sent values back to 574¢/bu.  In our terms, Dec-18 reached $285/t, before finishing yesterday at $272/t.

Figure 1 shows the classic rising price trend. Wheat prices are making higher highs and higher lows. At some stage, the market will make a lower high, which signals the end of the rally.

Wheat prices are trying to come to terms with this year’s lower production, but there has been a lot of speculator activity on the buy side. This might dissipate when harvest starts rolling in.

The latest US crop condition report has 38% of the wheat crop in good or excellent condition, compared to 50% last year. Poorer condition means lower yield, how much lower is the question.

Locally things were relatively steady despite the fluctuations in the US. The spreads of recent years remain in place, with price ranging from $355 at Newcastle for an APW Multigrade, to $296/t at Port Adelaide.

Canola prices in Canada have steadied at around $550/t in our terms. In quite an unusual quirk, new crop canola prices are still at a negative basis to ICE Canola. Yesterday’s Geelong Canola price for 18-19 was $546/t, despite what should be dwindling production expectations.

The week ahead

There are some promising signs on some of the 7-14 day rainfall forecasts, which might get the crop going in NSW if it eventuates. It’s interesting that basis hasn’t really gone as crazy are you might expect given the dry, with new crop supplies expected to alleviate some the current supply shortages.

The is some potential for downside in international markets, but not too near the 220s of earlier this year.  Maybe back to $250/t during the wheat harvest, and if summer rainfall is good in the US there might be more downside.

A nation embarrassed by a lack of rain

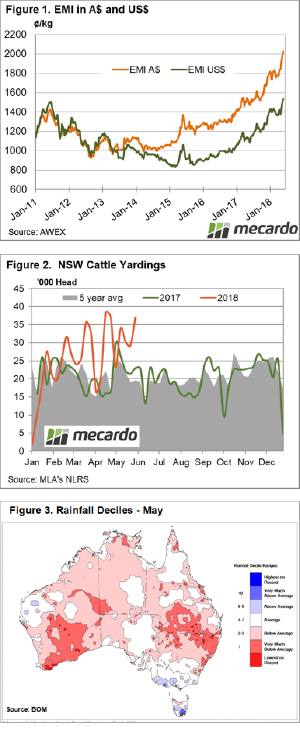
The Eastern Young Cattle Indicator (EYCI) continues to trek lower as cattle yardings reach a five-week peak, underpinned by high NSW cattle throughput. The EYCI closed this week 1.1% lower at 466.5¢/kg cwt, while its Western counterpart shed 3.2%. Despite the bigger fall in WA young cattle prices, producers there are still enjoying an 11% premium over their East coast neighbours, with the Western Young Cattle Indicator (WYCI) closing the week at 523.75¢/kg cwt.

East coast cattle prices were posting slightly mixed signals at the close of the week with Trade and Heavy Steers gaining 1-2% while the Medium Steer, Medium Cow and Feeder Steer Indicators softened between 1.5% to 4%.

Across the east coast states, cattle prices reflected either the presence or lack of rainfall during the week. In Queensland most cattle categories were flat on the week, except for Trade and Heavy Steers, acting as market book-ends. QLD Trade Steers are finding it tough with a 5.1% drop to 256¢/kg lwt, while QLD Heavy Steers posted a 2% gain to 261¢/kg lwt. NSW cattle categories are mostly 1-2% softer, with NSW Trade and NSW Restocker steers bucking the trend to see them gain 1.5%. In Victoria, gains were noted between 1-4% for all categories of steer, but Vic Medium Cow was the only disappointment to producers – off 4% to 169¢/kg lwt.

The dry conditions prevalent in NSW and Southern Queensland  pushed additional cattle to market this week and is underpinning the 23% lift in east coast cattle throughput to nearly 72,000 head – figure 1. NSW sale yard yarding levels are remaining the key driver of the higher east coast throughput with a 27% surge in numbers this week to sit just shy of 37,000 head (Figure 2).

The rainfall deciles map for May highlights the plight of cattle producers across much of the country in the past month. Victorian and Tasmanian regions were the only parts of the country to see reasonable areas of average to above average falls, and hardly any below average areas present (Figure 3.) This was a stark contrast to the rest of the nation – and perhaps a mostly red continent embarrassed by a lack Autumn rain.

What does it mean/next week?

The three-month rainfall outlook released by the Bureau of Meteorology yesterday doesn’t paint a great picture for NSW, SA, Northern Victoria and Southern Queensland. Much of the South-East corner of the nation is set for a dry Winter so don’t hang your hopes on a recovery in cattle prices in the near term.

Flatlining retail lamb prices leaving saleyard upside open

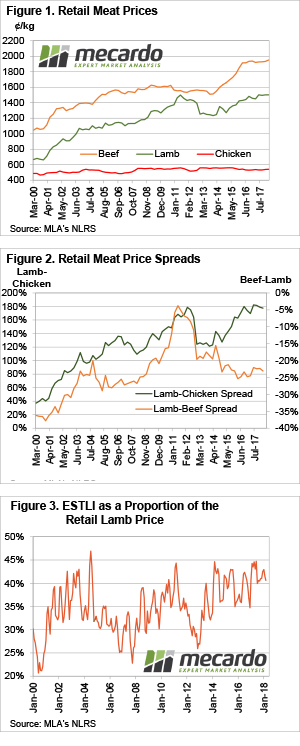
Since hitting a peak back at the start of the year, lamb prices have eased and found somewhat of a base around the 600¢/kg cwt mark. We know that strong demand has been driven by export markets, but there appears to be a limit to how much the local consumer is prepared to pay for their lamb.

Retail red meat prices have flatlined for over a year at the top of the historical range. Driven by high livestock prices and competition from export markets, retail lamb reached a record of just over $15/kg back in January 2017.

Since then, retail lamb prices have basically tracked sideways (figure 1). Chicken prices have also been steady, while the March quarter saw beef prices record a 1% increase to set a new all-time high of $19.51/kg.

Retail lamb has spent the last three quarters at close to a 180% premium to the chicken price, a similar level it reached at the end of 2012. Compared to beef, however, lamb remains relatively cheap at the retail level, at a 23% discount.

When lamb price peaked in 2011 they got within 5% of beef prices at the retail level, and this saw some consumer resistance and subsequent weaker domestic demand. Despite being cheap relative to beef, the strong premium to chicken, and pork, might have put a lid on how much further retailers can push prices.

With the retail lamb price being steady in the March quarter, the falling Eastern States Trade Lamb Indicator (ESTLI) is seeing the lamb price making up a smaller proportion of the Retail Price. Figure 3 shows the recent decline in the saleyard price has the ESTLI back at 41% of the retail price. Around 40-41% has been the low since the start of 2017, while the ESTLI has been as high as 45%.

What does it mean/next week?:

The fact that retail lamb prices have been steady for the best part of a year suggests that consumers are now relatively comfortable with the record values  This is good news for saleyard lamb prices.  However, lamb is priced at a historically comfortable level relative to beef and is expensive compared to chicken. The concern for lamb retail prices will come if the lower cattle values we are seeing flows through to retail level. Lower retail beef price might put some pressure on domestic lamb demand.

There is a little room for saleyard lamb prices to improve relative to the retail level, so there is some upside potential.  Importantly, retail lamb prices can also fall without necessarily taking saleyard lamb prices with them.

Another week, another 400k lambs exit the system

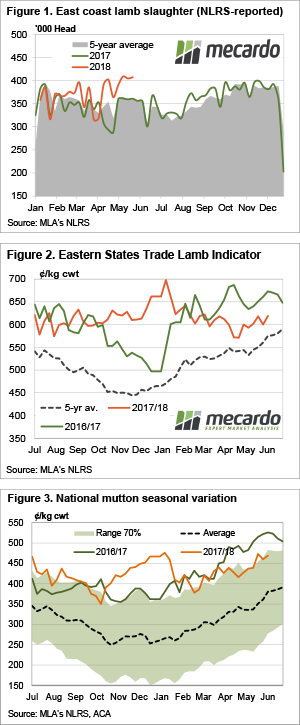
After the TFI fire in January, you’d have been thought crazy if you said that weekly east coast lamb slaughter would spend most of May above 400,000 head. Even crazier if you said sheep slaughter would be 30,000 head higher than last year, yet here we are.

The confluence of strong lamb and mutton demand, and drought-induced strong supply has seen Victorian and NSW processors killing many more lambs and sheep than last year to keep up. East Coast lamb slaughter has never been above 400,000 head for three weeks in a row (Figure 1). It’s also been five years since this many sheep and lambs have been slaughtered in May.

Saleyard reports suggest the supply of finished lambs might be starting to wane, and this saw the Eastern States Trade Lamb Indicator (ESTLI) gain 18¢ to close at 619¢/kg cwt on Thursday, the highest price since March (Figure 2).

As we move into June, it is now that prices don’t look that great. Historically, anything over 600¢ is a good lamb price, but it’s becoming the norm in June. This will be the third year in a row, albeit prices are still around 10% behind the 2017 June price.

Mutton prices gained a little ground, with good mutton making over 500¢/kg cwt, and the average at 469¢.  It wasn’t that long ago that $5 was a good price for lambs.

Over in the west, trade lambs were up 20¢ to 626¢/kg cwt, not quite matching Victoria at 630¢ but still very strong. WA mutton is lagging well behind however, at 390¢, but some good recent rain might help this.

The week ahead

Some of the 7 and 14-day rainfall maps are starting to show some precipitation for NSW.  No guarantees, but if it eventuates we can expect a decline in sheep supply. This might coincide with annual plant maintenance shutdowns, but we still expect prices to strengthen over the coming month.

“I would rather be selling than buying in this market!”

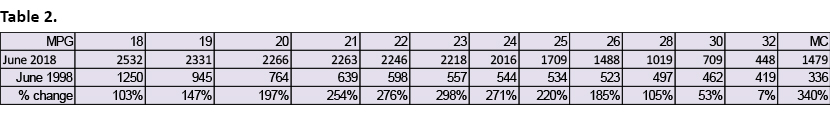
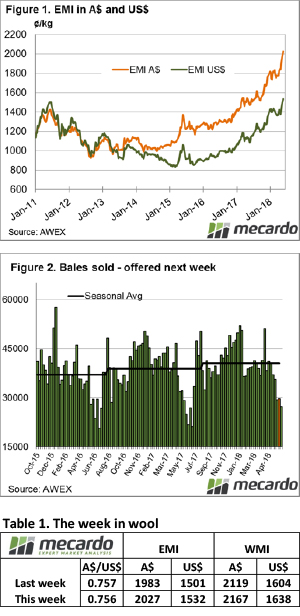
Who would have thought that 2,000 cents were possible for the EMI, or that only the 25 MPG and broader would sit below the 2000 cent level?

This wool selling season the EMI has lifted a massive 38%. In June 2017, it was quoted by AWEX at 1472 cents and this week settled at 2027 cents.

At the Campbelltown Show last week (by the way it was the 180th consecutive show, a fantastic effort by present and past show presidents and committee to achieve this over such a long time), a story was recounted to me that a couple of years ago at an AWI meeting one of the members suggested that 2000 cents was possible in 2018!

He was told by others at the meeting that while possible, don’t tell anyone because it sounds too far-fetched!

This week another small offering came forward, with just 30,329 offered to the trade. At a pass in rate of 2.3%, this meant 29,729 bales were cleared. This is 11,000 bales fewer than the weekly average of almost 41,000 bales for this season.

AWEX reported that buyers “had to work hard” to secure their volumes, and showed little regard for style and specifications. As supply has declined the discounts from earlier in the season for lower style and spec wool have declined.

It was also a new record for the EMI this week in US$ terms, breaking the previous level of 1504 set in June 2011, the increase this week of 32 cents pushed the US$EMI to 1,533 cents (Figure 1). The Australian dollar had a stable week, trading at US$0.757.

The Western Market Indicator (WMI) rose 48 cents on the week to post another record of 2167 cents.

To add some perspective, on this selling week, 20 years ago (1998) the 19 MPG was 945 cents and the 21 MPG 639 cents; they have lifted 147% & 254%, respectively (Table2).

Fine wool volumes have risen relative to the rest of the clip over this period and consequently, medium merino wool has declined. This is reflected in the price movements with the larger % improvements across the traditional medium to broad MPG categories.

The stand-out performer over this period is the Cardings sector; a 340% lift over 20 years is quite remarkable and signals strong demand for shorter wool.

The week ahead

Fremantle market has next week off, so only 27,270 bales are rostered, with 32,000 and 26,000 listed for selling weeks 50 & 51.

We are in unchartered waters so predictions are difficult, but it is hard not to be excited by this market. As a knowledgeable wool person in Tasmania said, “I would rather be selling than buying in this market!”.