Year: 2019

Cattle supply overcoming export demand

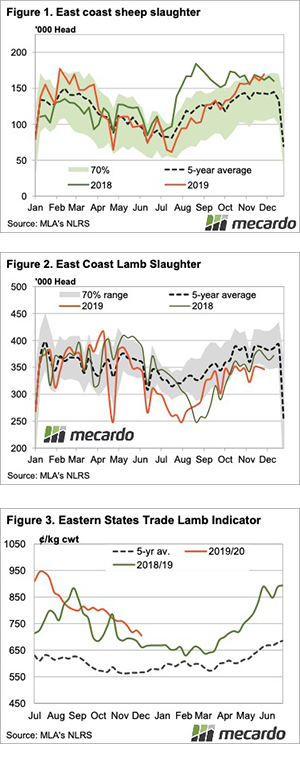
There have been no real movements in strong export beef prices in recent weeks, but cattle prices have been on the decline in saleyards.  It seems slaughter capacity might have been reached, and with processors booked up until Christmas, demand at saleyards is on the wane.

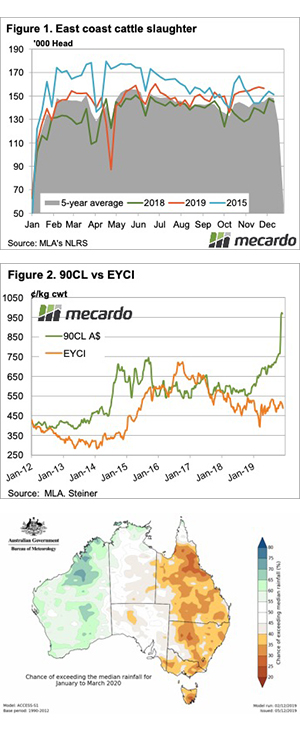
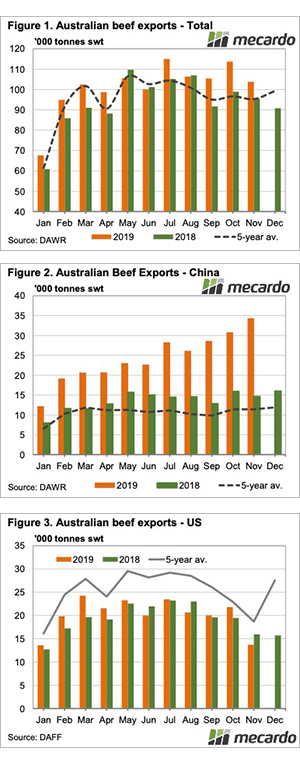
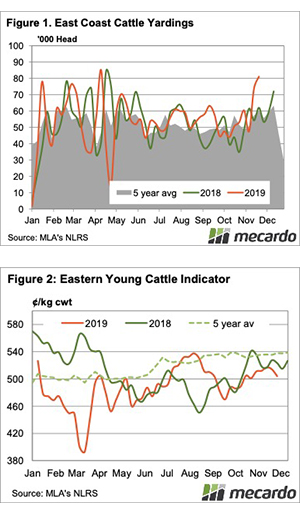
As we move into December the season definitely hasn’t improved in a lot of areas, and the cattle keep flowing.  Cattle slaughter reached a six month high a fortnight ago and is still bumping up against four-year highs.

Figure 1 shows the last time cattle slaughter was this consistently strong on the east coast was in 2015.  Interestingly, the EYCI at this time in 2015 was 600¢, showing the difference restocker demand can make.  Heavy steer and cow prices were similar to what we are seeing now, but margins for processors were much tighter.

We can see in figure 2 that at the end of 2015 the EYCI and 90CL Frozen Cow were priced around the same level.  Now the 90CL is at a 450¢ premium, not quite double the EYCI.

Slaughter capacity has been up to 11% higher in the past, but processors are no doubt reluctant to invest in opening up more kill space given the declining herd.  A good rain will see the supply of all cattle types tighten, and would mean processors would face the costs of closing down the extra space.

Cattle prices were down across the board last week, with declines between 10 and 30¢/kg cwt.  This might see supply tighten, and have growers waiting until the New Year.

Next Week:

There is yet again no rain on the forecast, and the outlook remains bleak for the next three months (figure 3).  It doesn’t mean it can’t rain, but it is still more likely to be dry.  Cattle can’t keep coming forever, and it is likely we’ll see things tighten and prices steady in January.

All downhill ‘til Christmas?

A strong offering had the typical effect on wool prices, the market sliding another step lower this week. Growers protested the downward trajectory in hordes with passed in rates hitting 20.4% to see a total of 7,765 bales returning to brokers’ stores.

The Eastern Market Indicator (EMI) lost 38 cents for the week to close at 1,492 cents. The AU$ opened strongly which played into the lack of buying enthusiasm. The AU$ rose 0.07 cents for the week to US $0.684. In US terms, this pushed the EMI down just 15 cents to 1,020 cents.

The Western Market Indicator experienced falls in line with the eastern markets. The WMI dropped 36 cents for the week to finish at 1,604 cents. AWEX reported that lesser style wools did not fare well in this week’s market. Buyers continually discounted their pricing levels and by the end of the series, had fallen 50 to 80 cents.

The national offering was 322 bales higher this week for a total of 38,149 bales. However, the high passed in rates meant the number of bales sold was down by over 2,000 on last week’s volumes. Just 30,384 bales were cleared to the trade for the week. This season’s bale clearance continues to lag well behind 2018 at a difference of 100,281 bales. The average weekly bales volume is currently 5,164 behind last year.

The dollar value for the week was $50 million flat, with the average bale value sitting at $1,645, drifting $19 per bale below last week’s average. The combined value so far this season is $945.47 million.

The crossbred sector fell across all microns, losing 20 to 45 cents. Oddments were the only category to record gains. The Merino Cardings Indicators rose by an average of 2 cents across the three selling centres.

MAP your route

This week’s grain market update includes a look at ‘cheap’ offers of fertilizer in Australia & the slowness of the Victorian harvest.

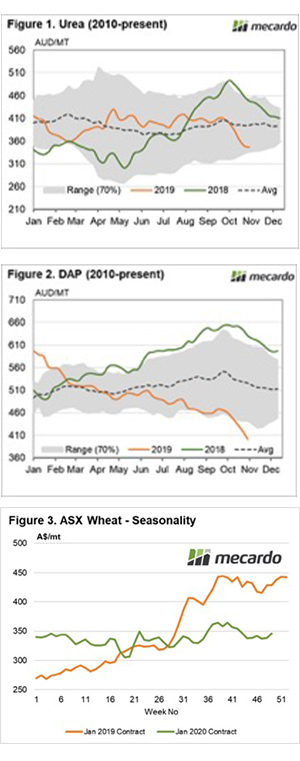
Recently I wrote an analysis article on the performance of the global fertilizer market (read here) and had a follow-up podcast with Chris Lawson of CRU (listen here). In these reports, we discussed the fact that Urea had fallen A$64/mt since September (figure 1) and DAP was down a massive A$196/mt since the start of the year (figure 2).

There is a lack of transparency in the fertilizer market. There is no open and publicly available pricing for fertilizer in the same way that we see for grain, wool and livestock prices. This means that largely pricing intelligence on local fertilizer tends to be anecdotal in nature.

Nonetheless, we have received reports from several readers who have informed us of offers that are substantially below recent years levels. As an example, there are offers of A$530/mt for MAP in VIC & SA. These same readers informed me that they paid >A$700 this time last year for supplies.

There are questions remaining about whether it is time to purchase, or whether there will be more cheaper parcels on the way due to the lower overseas prices. Whether it drops further or not, this year is likely to have a lower fertilizer cost than last.

On the grain front, the ASX contract has risen this week by A$7/mt to hit an average of A$345 for the week. This remains at a substantial discount to last year’s strong drought premiums at A$428 for the same week (figure 3). For producers looking forward to next year, there have been attractive trades for January 2021 at around A$340.

Harvest remains slow in Victoria due to uncooperative weather, however, is likely to move ahead with gusto in the next fortnight. There are many consumers who have been ‘hand to mouth’ buyers during November and December. There were many hoping for an early harvest that hasn’t transpired resulting in continued strong premiums for old crop grain.

Remember to listen to the  Commodity Conversation podcast by Mecardo

What does it mean/next week?

The big question remaining on everyone’s lips is what comes of the Victorian harvest. The ABARES report earlier this week confirmed that Victoria is the jewel of the nation this year.

Will there be harvest pressure in the coming weeks?

Beef exports down but China still rising

Beef export figures for November are out, and we are getting a picture as to why export prices have been running rampant. While the total supply of beef for exports declined in November, it didn’t stop China from posting yet another record import level. 

Cattle slaughter was still relatively strong in November, so it is likely the cattle were lighter.  November beef exports were down 9% in October, but up 9% in November 2018.  In fact, November exports have only ever been higher once, in 2014.

Declining export volume didn’t stop China from taking yet another record amount. Figure 2 shows China was easily the biggest market for Australian beef, taking 33%. The comparison numbers again show rapid growth. The 34.2 million tonnes exported to China (figure 2) was up 12% in October and 134% in November last year.

With 90% of the beef exported to China being frozen, it is pulling more and more beef away from the US. Figure 3 shows declining US exports, with November being down 37% on last month and 14% on last year. Exports in November were also the lowest for that month since 2016, when total supplies were much tighter.

The US share of exports was 26% back in November 2016, and just 13% last month. This share was the lowest since 2010. There is not a glut of beef in the US, they are still very much chasing our exports. It seems that China simply has more money for beef at the moment.

Japan and South Korea managed to maintain their share of our beef exports, but in general, they are after more expensive cuts of beef.  With manufacturing beef prices still rising, there might be some better cuts going through the grinder.

What does this mean?

We’ve been following the rising 90CL beef prices over the last month and the rally in price fits nicely with export flows. The reports of US buyers scrambling for beef in a rising price environment shows up in much more beef going to China and much less to the US.

The market is still waiting for Chinese beef demand to flatten out, and see some sort of equilibrium reached in export markets. At present, however, things are still highly uncertain.

Mutton slaughter rising, but prices steady

Sheep slaughter had its second highest week for the year as sheep continue to flow into markets.  There has been little impact on prices however, as with lamb, slaughter is down, there is still kill space to fill.

Chinese mutton demand continues to run hot.  Mutton slaughter was very high last week, yet the National Mutton Indicator remains at very strong levels, at 572¢/kg cwt this week.  Victorian Mutton did come back from record highs, losing 39¢ to 614¢/kg cwt.  Victoria is still the strongest in the state, just not as strong as last week.

Lamb slaughter remains well below last year, despite plenty flowing out of the south. The north-south split remains, but both NSW and Victorian lamb slaughter were 10,000 head below 2018 last week.

Figure 3 shows the Eastern States Trade Lamb Indicator (ESTLI) is still in decline, losing another 20¢ this week to 705¢/kg cwt. The ESTLI is still holding a 44¢ premium to last year, obviously being helped by tighter supply.

The National Mutton Indicator is at a 140¢ premium to last year, so it is doing a lot better.

WA Trade Lambs moved past the east coast this week, up 7¢ to 716¢/kg cwt, which combined with the ESTLI fall saw WA the more expensive.  In Victoria you could almost say trade lamb prices (686¢) tanked, losing 35¢ to be the cheapest lambs in Australia, apart from Tasmania (646¢/kg cwt).

Next Week:

The latest BOM outlook is less than promising for the east coast. If it remains dry we could see supplies remain strong, with females and Merino wethers adding to supply. If it gets wet, lamb prices probably have further to rally than sheep.

Live cattle flow on the up

The October release of LiveCorp live export cattle flow shows a steady gain in volumes since August. This analysis piece looks at the breakdown of the trade with a focus recent changes to the flow to key export destinations and ports of exit.

The monthly flow of live cattle has reached its highest point this season in October at 117,511 head, mirroring a similar magnitude surge during October of 2018 (Figure 1). This places live cattle export volumes 21% above the five-year seasonal average trend for October.

Fueling the increased flow of Australian live cattle exports in recent months has been a resurgence in demand from Vietnam between August to October. Indeed, for the August to October period, the flow of Australian live cattle to Vietnam has averaged a 69% increase in the five-year seasonal pattern (Figure 2). In contrast, Australia’s largest live cattle trade partner, Indonesia, has demonstrated 10% higher flows over the same timeframe.

The changing dynamic of the live cattle trade isn’t just limited to destination points. Similarly, there has been a noticeable change in exits ports from Australia in recent years. Townsville has seen a steady rise in live cattle departures, pushing Queensland’s market share of departures from 24% in 2018 to 27% in 2019. Although, this has come at the expense of ports in the remaining key live cattle export states of the Northern Territory (NT) and Western Australia, down from 37% to 31% and from 21% to 19%, respectively (Figure 3).

Historically there has been a preference for live cattle exports from the NT to favour an Indonesian destination when assessing on both a volume and percentage of trade basis. Whereas flows out of Queensland favour Indonesia on a volume basis but is heavily geared towards Vietnam when comparing it by the percentage of total trade to each destination.

In the last five years (2014-2018), the volume of live cattle from the NT to Indonesia has averaged nearer 300,000 head per year, compared to 60,000 head into Vietnam. This equates to 55% and 30% of the total Australian live cattle trade flow to Indonesia and Vietnam, respectively.

During 2014-2018, Queensland has averaged 140,000 head to Indonesia and 89,000 to Vietnam. This equates to 26% and 43% of the total Australian live cattle trade flow to Indonesia and Vietnam, respectively.

What does it mean?

Given that Indonesia takes the lion’s share of Australian live cattle exports it is unsurprising that on a volume basis it is an important destination point for all export ports in the north of Australia. However, the importance of Vietnam as a key destination point for Queensland based cattle departures cannot be underestimated.

Certainly, the recent growth in Vietnamese demand for live cattle has underpinned the resurgence in flows from the port of Townsville. Indeed, average monthly flows from Queensland during the August to October period are running 147% above the five-year trend.

WA closing on the east coast

Despite the free-flowing supply in the south Victorian lamb prices found some support, while mutton moved to a new record. WA lamb prices have also rebounded strongly and are now not far off the east coast.

It might be that Victorian lambs are finding support from mutton. The spread between the two prices, usually quite large, has this week come into 78¢, with mutton at just a 10.5% discount. The mutton discount is about as small as it gets, but last time it was when restocking was in full flight.  This time it is more about export demand.

Figure 1 shows Victorian mutton sitting at a new record of 643¢/kg cwt, now well ahead of NSW. It might be that fat sheep are coming out of Victoria, supporting the ¢/kg rate, relative to lighter sheep in NSW.

Lamb supplies appear to be tightening in the west, with trade lamb prices rising to a 3 month high of 709¢/kg cwt. Figure 2 shows that lambs in the west are now coming close to their east coast counterparts, after being at a discount for some time.

Mutton in WA remains at a large discount to the east coast.  It seems supply is still outstripping kill space, but as lamb supplies decline we might see some upside in mutton. WA Mutton might not get to east coast levels but should get stronger

Next Week

Lamb slaughter is heading sideways, and it seems it might have hit its limit for now. This obviously bodes well for prices, with 700¢ looking like the support level. There are apparently plenty of lambs booked up for December but some space might become available if mutton supplies decline.

Record spring yardings dampening prices

Cattle prices continued to ease this week in the face of more rises in export markets. There is little doubting the driver behind lower saleyard prices, with the season yet to break and relatively strong prices drawing out supply.

It’s always about supply and demand. In the last couple of weeks, it has been increasing supply overwhelming strong demand. Figure 1 shows east coast cattle yardings hit 80,000 head last week.  Cattle yardings have only been this high once this year, back in April.

In fact, cattle yardings have never gone over 80,000 head in the spring. The numbers are quite remarkable given the declining herd, but strong prices and little feed are pushing cattle into yards.  No surprises that NSW and Queensland are leading the strong yardings, both up 31% and 68% on last year respectively.

With the heavy supply, it is improving demand, from the more increases in export prices, which is stopping cattle prices from really tanking. The Eastern Young Cattle Indicator (EYCI) lost another 10¢ this week to hit a five-week low of 504¢/kg cwt (Figure 2).

Heavier cattle categories took more of a hit. The National Heavy Steer and Medium Cow Indicators fell 47¢ and 48¢ respectively. Having hit 3-year highs recently, supplies are likely to have picked up in saleyards as growers try to take advantage of the highs.

The 90CL Frozen Cow indicator gained another 12¢ in our terms to post yet another record of 972¢/kg cwt.  In US terms, it hit the magic 300¢/lb, surpassing the September 2014 record. Never has cow beef been more expensive in the US, at least in nominal terms.

Next Week:

There has been a bit of precipitation about this week and there’s a bit more on the forecast. Given the much lower prices this week, we might expect as sharp a pullback in supply and steadier prices.  Some rain would obviously help find support and there should be some upside.

Wool market back to the base

Since October, we’ve seen the market oscillate from gains to losses at the turn of each week. However, this week saw the second consecutive week of declines with both the eastern and western markets ending November back near the base levels found after the period of volatility during Winter.

The market has largely traded within a 100 cent comfort zone for the last two months and is currently closing in on the lower end of that range. The Eastern Market Indicator (EMI) lost 30 cents, on top of last week’s 19 cent fall to close at 1,530 cents. The AU$ fell marginally by another 0.03 cents to US $0.676. In US terms this pushed the EMI down 22 cents to 1,035 cents.

Fremantle fared the best of the three selling centres In the weakened market but didn’t escape a fall of 15 cents in the Western Market Indicator to end the week at 1,640 cents.

High pass-in rates continued, with 14.2% of the national offering passed-in. This was a small decrease of 1.5% compared to last week’s rate. Supply was slightly lower this week, with the national offering down by 471 bales to 37,827.  The number of bales sold was nearly unchanged at 32,464 for the week. This season’s bale clearance continues to lag well behind 2018 at a difference of 100,058 bales. The average weekly bales volume is currently 5,266 behind last year.

The dollar value for the week was $54.03 million, with the average bale value sitting at $1,664, drifting $27 per bale below last week’s average. The combined value so far this season is $895.47 million.

The crossbred sector edged lower again with 26 to 28 MPG’s losing 30 to 45 cents. The broader microns received more support with just a 10 cent decline for 30-32 MPG’s. The Merino Cardings Indicators managed to hold their ground for a second week in a row, remaining relatively unchanged.

The week ahead

Another large offering is on the roster for next week with 41,274 lined up across the three selling centres for sales on Wednesday and Thursday.

With just 3 more weeks of sale before the market closes for the Christmas recess, volumes are tipped to remain strong with 39,513 and 37,278 bales scheduled for the following weeks.

Blighted barley

American markets have closed for the Thanksgiving holiday. Whilst they relax eating pumpkin pie and turkey the rest of the world carries on. In this week’s comment, we take a look at barley pricing.

The barley market has been under immense pressure over the past year. The past six months have seen a strong decline in pricing however the past fortnight has seen prices largely stabilise.

Since June barley pricing has declined by the following levels:
• Adelaide -19%
• Geelong -24%
• Kwinana -14%
The premium for wheat has increased dramatically since August, when (in Geelong) the premium started the month at A$10/mt. The premium has since increased to A$52/mt (figure 2), which is closer to long term average premiums.
The change in pricing levels has made barley far more attractive for feeding. During the past season, many consumers opted to reduce barley and utilize a higher level of wheat in feed rations. The consumers are now switching back to barley at these levels, however, will be keeping a close eye on changes to the spread.
The ASX wheat contract received some attention this week, with 53kmt trading on the exchange. The market has averaged A$338.25/mt for the week, which is up A$1 from last week. From a seasonal perspective, the harvest contract is down A$89/mt from the same week last year.

What does it mean next week?
As we move into December, we will see harvest moving further south into Victoria. Yesterday, I visited some crops in the Western Districts and they looked very good. As the wheat goes into the bins we may see some harvest pressure due to the heavily unsold positions by producers.