Category: Cattle

Restockers still in the game

When we set out to write this article, we thought it was going to be about how restocker demand was on the wane, and one of the reasons the cattle market was falling.  While restockers are paying less, they are still buying plenty of cattle.

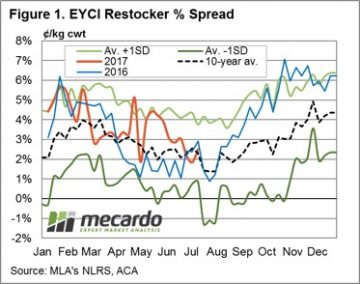
With the dry weather being experienced across much of the east coast, we expected to find restocker demand had been weaker.  Figure 1 shows the spread of the price paid by restockers for EYCI cattle, compared to the EYCI itself.

Restockers are not paying as much of a premium as they were, but it has only fallen back to average.  Last spring and summer restockers were paying 4-6% more than the EYCI.  As the restocker premium eased in March, as did the EYCI.  When restocker demand ramped up again, the EYCI rallied, and subsequently fell again, seemingly on the back of the restocker premium falling from 4% to 2%.

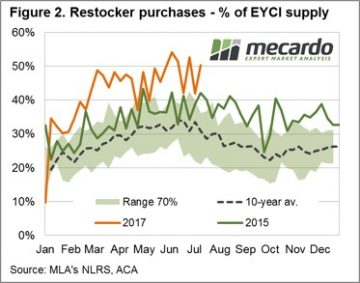
With the weakening in the restocker premium, figure 2 shows that restockers are not buying any smaller proportion of cattle.  Over the last 9 weeks restockers have bought 49% of EYCI cattle, compared to just 38% over the same period last year.  It would seem the falling premium being paid by restockers is more due to increased supplies of suitable cattle.

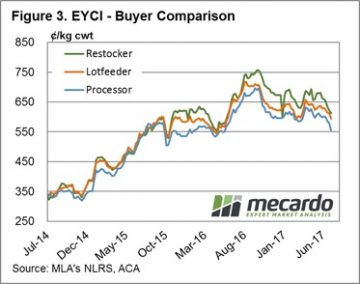
This is somewhat confirmed by the smaller fall in the price paid by feeders for EYCI cattle over the last six weeks.  Figure 3 shows that feeders are paying 7% less than at the start of June, while restockers are down 10% and processors price have weakened 8%.

It does stand to reason that during dry times more light cattle, suitable for restockers, will come to market.  This also means that fewer heavier store cattle suitable feeders will be available, while the supply of finished cattle, for processors will be even weaker.

We are still some way from the drought spreads of 2014-15, when restockers, feeders and processors were all paying the same price.

Key points:

  • Dry weather has pushed the EYCI lower, with the restocker premium falling back to average levels.
  • Restockers are still buying plenty of EYCI cattle, which suggests supplies of restockers types are higher.
  • Widespread rain would see a turnaround in light cattle supply and restocker demand.

What does this mean?

Stronger supply of light store cattle is not the only reason for the weaker EYCI, but it is contributing.  For those lucky enough to have feed on hand, the fact the restocker cattle are now more in line with historical premiums to the EYCI means they are reasonable buying.

Widespread rainfall on the east coast would see a rapid turnaround in young cattle supply and prices, but there isn’t much encouragement on the forecast.  Further dry weather is likely to see the EYCI continue to ease, and the restocker premium fall back to zero.


Forecast says more cattle coming

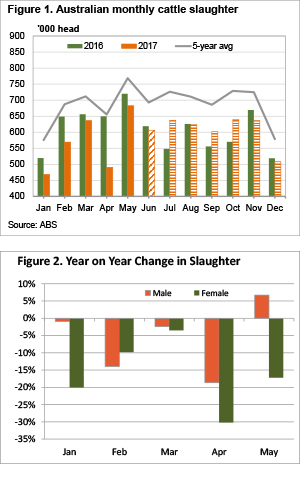
As we move past the half way mark of the year we can start to get an idea of how cattle supply is faring relative to industry forecasts. Those looking to sell cattle in the second half of the year will not only be hoping the weather does the right thing, but also that Meat and Livestock Australia’s (MLA) total cattle slaughter forecasts are an overestimate.

MLA’s latest cattle projection forecasts, released in April, pegged 2017 national cattle slaughter at 7.1 million head. According to the Australian Bureau of Statistics (ABS) the first five months of 2017 saw 2.84 million head of cattle go over the hooks. According to MLA’s weekly slaughter figures June cattle slaughter was around 2% behind 2016.

Figure 1 shows that using the ABS figures, and MLA’s numbers for June, has 2017 slaughter trading well behind 2016. Our estimate puts cattle slaughter for the first half of 2017 at 3.45 million head, 9.4% lower than 2016. More importantly, the total number of cattle slaughtered to the end of June is just 48.6% of MLA’s annual forecast.

For July to December we have applied average seasonality to the number of cattle which still need to be slaughtered to reach 7.1 million head. For the July to December period cattle slaughter will have to lift 5% on last year’s levels.

July 2016 was a very low slaughter month, as were September and October, when compared to the five year average. This is why figure 1 has most of the increased slaughter for the second half of the year in those months.

Figure 2 shows that the herd rebuild in the first five months saw the year on year decline in female slaughter outstrip their male counterparts. Up until May female cattle slaughter was down 16%, while male slaughter was down just 6%. Male slaughter was actually higher than last year in May.

On face value we can say that if supply is to pick up in the second half of the year, were more likely to see an increase in cows and heifers, than steers or bullocks.

Key points:

  • Cattle slaughter for the first half of 2017 has been 9.4% lower than 2016, and not on track to meet forecasts.
  • If Australian cattle slaughter is to meet forecasts, it will have to be 5% higher than last year.
  • An increase in cattle supply is likely to see prices remain below 2016 over the coming months.

What does this mean?

Simple economic theory says that higher supply, and steady demand, will result in lower prices. We are already seeing lower prices than last year in cattle markets, but the question is, how much lower can prices go? Given where export beef markets are sitting, and the fact we should be hitting the seasonal low point for cattle supply, it’s hard to see too much further downside in the short term.

However, if it remains dry we head into September, the increased supply could push the EYCI back towards the low 500¢ level. Downside is likely to be stronger for cows, while heavy slaughter steers are likely to fare better, as supplies haven’t been held back as hard in the first half of the year.

Down in the east tanking in the west

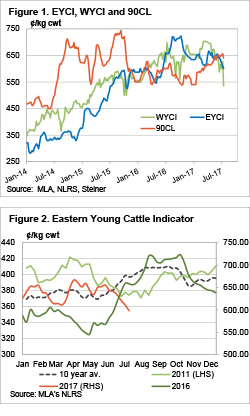
The Eastern Young Cattle Indicator (EYCI) fell for the sixth straight week, and took most other indicators with it. In the West prices tanked, but it might be an outlier. The story remains the same, with dry weather and relatively high prices encouraging offloading of stock.

Even the 90CL Frozen Cow Indicator got in on the falls this week, it tanked, losing 18¢, or nearly 3%, to 641¢/kg swt. Increased slaughter here is reportedly starting to impact supply, on the positive side, here.

Figure 1 shows that while the 90CL was lower, it’s still well above the EYCI, and this is one of the measures we use to judge cattle value. For the first time in nearly two years the EYCI seems undervalued.

Most other cattle categories drifted lower this week, to the tune of 10-20¢/kg cwt. The exceptions were cows, which managed to gain 5-10¢ in Queensland and Victoria.

Higher grain prices looking to be starting to bite feedlots. While still historically very strong, feeder prices this week fell 5-15¢ to range from 318¢ for Domestic feeder heifers, to 363¢/kg lwt for long-fed export steers. With grain prices now around $100/t higher than harvest, feedlots are obviously going to try and either increase grainfed cattle prices, or decrease feeders.

We suspect it may have been on small numbers, but the Western Young Cattle Indicator (WYCI) fell heavily this week, losing a massive 91¢ to hit a 22 month low of 536¢/kg cwt. Given that over the hooks quotes for yearlings in WA remain in the 580 (Grassfed)-630¢ (MSA) range we’d expect to see a bounce in the WYCI.

The week ahead

The movement in the EYCI this year is really like no other year. It is almost a mirror image of 2016, and cattle producers will be hoping this doesn’t continue. If it does we’ll be headed for sub 550¢ levels. It takes a very short memory if you think 550¢ isn’t an acceptable price. A good general rain will fix the ‘low’ price problem, there just isn’t one on the horizon.


No rain, no grain no price gain for feeders

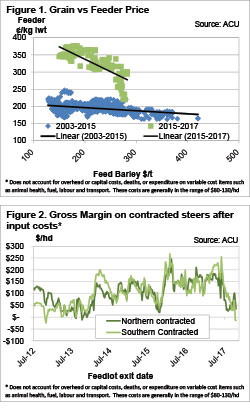
Grain prices have been on the rise. So what? A cattle producer might ask. How will it impact me? It depends what sort of cattle are being produced, but if it’s feeder cattle, rising grain prices are not good news.

Lotfeeders buy a large proportion of young cattle, and the other major input into a grainfed steer is obviously grain. The higher the grain price, the less money lotfeeders can pay for feeder cattle.

Figure 1 shows that feeder cattle prices have historically had a strong relationship with feed barley prices, but we can also see how this relationship has shifted since 2015. As grain prices rise, feeder cattle prices fall. The trendline on figure 1 shows that from 2003-2015, on average, a $50 rise in grain prices would equate to a 4.5¢/kg lwt fall in the feeder cattle price.

The trend became more pronounced at higher cattle prices after 2015. For the last 2.5 years a $50 rise in grain prices has, on average, equated to a 36¢/kg lwt fall in feeder cattle prices.

Over the last month east coast wheat prices have rallied significantly. New crop APW wheat has rallied $30 over the last month, while feed barley is up by a similar amount. Figure 1 shows there is actually a reasonably wide range of values of feeder prices at any given grain price, and this is due to other fundmentals.

Figure 2 shows how dire the move in grain prices might just be for lotfeeders. While many will have grain pre-purchased, those buying barley at current values, and paying 360¢/kg lwt for feeder cattle, are likely to be losing money.

Fortunately for feeder producers, young cattle supply is at its tightest level for the year over the coming two months. This may support feeder prices in the short term, but in the long term, higher feed prices are likely to start to bite young cattle values.

Key points:

  • Grain prices have a negative relationship with feeder cattle prices.
  • The strong rise in grain prices is likely to have pushed lotfeeder margins into the red.
  • Feeder cattle prices need to fall 30-40¢ to counteract the rise in grain prices.

What does this mean?

If grain prices and grainfed cattle prices remain around current levels, what price do lotfeeders need? On figure 2, lotfeeders need about $80-100/hd to break-even after overheads. The good news is it’s not a disaster. If feeder cattle prices fall to 330-340¢/kg lwt, it will be enough to see lotfeeders move back into the black.

On the upside, cattle producers growing heavy steers might actually find some support for finished cattle prices. Rising costs of production of grainfed beef generally tighten the supply of finished cattle, and push prices higher. Additionally, the decrease in the price of finished cattle, is unlikely to be reflected in the price of finished cattle, if it is due to grain price rises.

Heavy steers holding young cattle folding

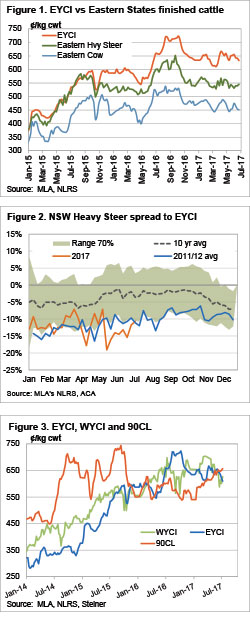
It was a better week for rainfall, with sporadic showers across the country, but it didn’t help the young cattle market. The Eastern Young Cattle Indicator (EYCI) continued its fall this week, but there was some support for slaughter cattle.

The EYCI fell a further 10¢ this week to hit a 12 week low of 610.75¢/kg cwt. This price is not far off a 12 month low, and now around 7% below the same time last year. A small rise in yardings was likely responsible for the fall in the EYCI, but there might be some waning restocker and feeder demand.

It doesn’t seem to be demand or supply of slaughter cattle which is sending the EYCI lower. Figure 1 shows that while the East Coast Heavy Steer price has reached the stratospheric level of last year, it hasn’t been falling in line with the EYCI lately.

Figure 2 shows that there is still some way to go for heavy steers to reach the ‘normal’ spread to the EYCI for this time of year. The NSW Heavy Steer has rallied from near a 20% discount to the EYCI to an 11% discount. The average for this time of year is 2%. If the spread returns to 2%, it will mean the EYCI has to fall to 560¢, or the Heavy steer will have to rise to 600¢.

Over in the West the slide in the Western Young Cattle Indicator has halted, and it even rallied a bit this week, finishing at 627¢/kg cwt.

The 90CL Frozen Cow Indicator was up 10¢ in a short week in the US to 656¢/kg swt. This is a 20 month high, and 9% stronger than this time last year. Processors are definitely doing a better job of keeping a lid on prices this winter.

The week ahead

Rainfall is forecast to again be sporadic, not really providing too much impetus for prices rises. The cold weather should start to bite on the finished cattle market, although with record cattle on feed, and rising grain prices we could see more cattle from that sector.

Young cattle supply doesn’t come from nowhere, and this is likely to support values in the short term. If the late winter and spring does fail however, the 550¢ mark is shaping as an initial target.

Live export market share and price relationships

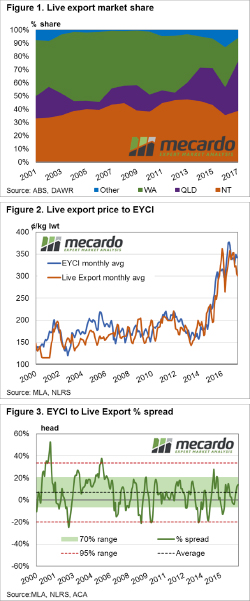
It has been some time since we had a look at live cattle exports so we thought it timely to focus in on the changing market share of the live cattle trade among the key export states, along with the price relationships that exist between live cattle and domestic young cattle.

Figure 1 outlines the percentage of market share in volume terms that are attributed to the three largest exporting states for live cattle, namely the Northern Territory (NT), Queensland and WA. Historically, NT and WA have held the lion’s share of the trade volumes over the last two decades. NT market share has been relatively stable fluctuating between the seasons from 35-45% of the total trade volume. In the last five years there has been a noticeable expansion of volume exiting Queensland. Indeed, for much of the period from 2001 to 2013 Queensland accounted for 10-20% of the trade. However, in recent times the proportion of live cattle leaving Queensland has extended toward the 25-30% range.

Turning our attention to price movements we can see a fairly strong relationship between average monthly EYCI prices when compared to a Live Export Index (created by averaging the live weight prices per month out of the ports of Broome, Townsville and Darwin). Analysis of the correlation between the monthly EYCI and the Live Export Index shows a correlation co-efficient of 0.83, which is indicative of a reasonably strong relationship between the two-price series. The correlation in price movement increases to 0.94 when the two-price series are compared on an annual average basis.

Analysis of the historic monthly percentage spread between the EYCI and the Live Export Index shows the EYCI to Live Export long term average spread sits at a premium of 7% and spends 70% of the time fluctuating between a 6.5% discount spread to a 20% premium spread (green shaded zone – figure 3). The red dotted lines highlight the 95% range between a 20% discount spread to a 33.5% premium spread, indicative of the extreme ends of the historic range.

What does this mean?

Analysis of seasonal live cattle trade flows shows that volumes out of Queensland tend to peak in the first quarter of the year, while WA peaks mid-year and NT peaks at the end of the season. This would suggest that the current market share of volumes out of Queensland at 28% is likely to diminish slightly as the year progresses and volumes out of WA and NT expand.

The current percentage spread of EYCI to Live Export prices sits at a 14% premium, and within the 70% range banding, which indicates that price levels for the two data series are comfortably within the “normal” range and suggests that neither price is too far over or undervalued in comparison to the other.

Key points:

  • Live cattle volumes exiting Queensland has shown steady growth in percentage market share in the last five years.
  • Movements of the EYCI and Live Export cattle prices show a close relationship over both monthly and annual average comparisons.
  • The EYCI tends to sit at an average premium spread to Live cattle prices at around 7%, but can fluctuate between a 20% discount to a 33.5% premium, dependent upon the season.

It’s a rare thing for cattle prices to fall in June

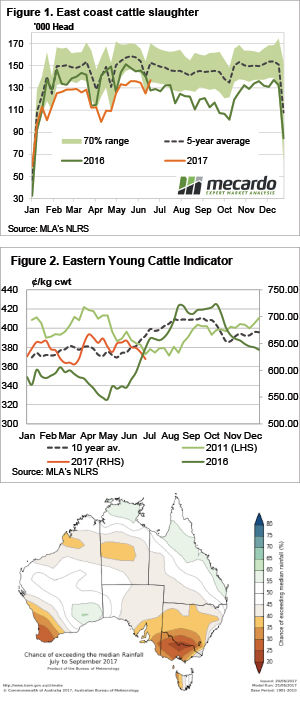
Here’s a quiz question. When was the last time the Eastern Young Cattle Indicator (EYCI) finished June lower than it started? You’ll have to read the article to find out….

Young cattle markets continued to slide this week, the EYCI dropped another 12¢ to finish the week, and the month at 621¢/kg cwt. Dry weather and historically high prices appear to be driving cattle to market as a time when supply is usually tightening.

Nothing exceptional is happening with cattle yardings, they were down a touch this week, and largely in line with the same week of the last two years. Cattle slaughter is doing strange things however. In the week ending last Friday, east coast cattle slaughter reached a peak for 2017, setting a 7 month high.

Figure 1 shows MLA’s weekly cattle slaughter figures hitting 137,019 head, 7% higher than the same week last year. It was also the first time weekly slaughter had been higher than the previous year since this exact week back in 2015.

If something sounds familiar, but backwards, it’s because we have been banging on in recent weeks about prices falling below the same time last year for the first time. It was the EYCI’s turn this week (figure 2), posting a lower price than the same week in the previous year for the first time since March 2014.

It’s always a nice fit to see stronger supply than last year equating to weaker prices. It tells us demand is relatively steady, with price being governed by supply.

The week ahead

The answer to the question is given away in figure 2. In 2011 the EYCI finished June lower than it started, by 24¢. This year it was 34¢. It also happened in 2003, so that’s 3 out of 18 years cattle prices have fallen in June. It’s not a regular occurrence. The good news for cattle producers is that in 2011 prices levelled out, but figure 3 shows this might just be the start of the slide.

Queensland outshines NSW

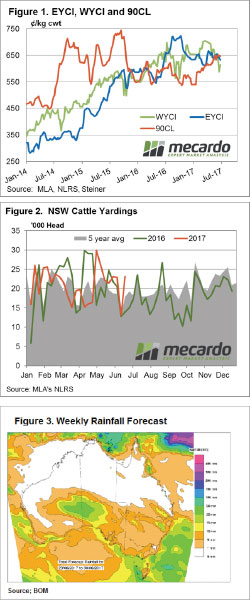
A good recovery staged by Queensland across the board, while NSW disappoints… no I’m not talking about the State of Origin – although the phrase fits there too! Actually, it’s the cattle market this week. Despite the national market indicators posting largely flat results, with weekly moves of less than 2% either way some state based indicators saw more substantial action.

The headline Eastern Young Cattle Indicator (EYCI) mirroring the national saleyard indicators with a minor retracement of 1.3% to close at 633.25¢/kg cwt, yardings of EYCI cattle up 22% on last week a potential reason for the softer prices. In contrast, young cattle price in WA recording an impressive 4.5% gain to close at 615¢/kg cwt and the key export indicator, the 90CL frozen cow relatively flat on the week, dropping just 1¢ to 646.8¢/kg CIF – figure 1.

Big winners in Queensland (other than the Cane toads) were Trade Steers, with a 13% lift to 336¢/kg lwt. The remaining QLD indicators up too (0.5-4.5% increases) with the exception of Medium Cows at 214¢/kg lwt, a fall of 1.6%. NSW saleyard indicators all softer this week, with falls ranging from 1-3%. NSW Medium Steers showing the biggest live weight percentage price drops, down 2.8% to 298¢/kg. A bit of a mixed bag for Victoria, with Feeder Steers down 3% to 325¢/kg lwt and Medium Steers up 5.7% to 315¢/kg.

Increased weekly throughput a potential reason for the broad price falls in NSW with yardings up 76% on last week and 29% above the long-term average for this time of year to see over 23,000 head change hands – figure 2. Perhaps the extended dry spell is starting to have an impact on supply and effecting the normal seasonal winter price rally. In case you missed it, Thursdays analysis piece on Mecardo takes a look at the potential impact of continued dry weather event and is worth a read.

The week ahead

The rainfall forecast for the week ahead showing some much-needed moisture to SA and lighter falls to the much of the South, but most of the decent stuff concentrated in the Tasman Sea. It is unlikely these falls are going to put a rocket up cattle prices this week but might be enough to continue to encourage consolidation at current levels. Although I’m Melbourne born maroon blood flows through my veins so eyes focused on the final State of Origin in just over a fortnight to see if the Toads can stage another upset.

What to expect if it stays dry

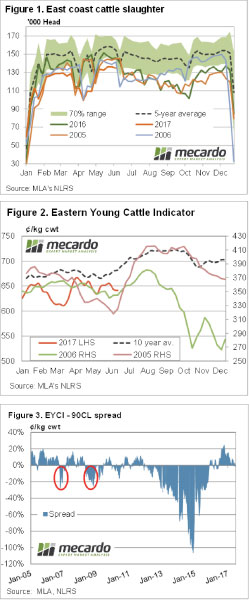
Whether or not you believe the Bureau of Meteorology (BOM) three month forecast, there is always the chance the current dry spell could continue. Dry winter’s and springs are not great for cattle prices, but given the current historically strong values, how bad could it get?

The usual impacts of a dry winter and spring are relatively predictable. Cattle producers usually hold out on selling cattle until past the point of no return, while grain prices inevitably rise. Come mid spring there is a rush to offload stock, while demand has weakened, leaving prices in freefall.

To work out where prices might end up, we can take a look historical slaughter during dry times, and associated prices. Obviously fundamental price levels have changed somewhat since the most recent dry spring, but we can try and account for this and come up with a base level for cattle prices.

The 2005 and 2006 seasons are a reasonable template for the market to follow. In 2005 cattle markets reached record highs on the back of strong demand, and a herd rebuild restricting supply. The following year saw cattle supply track in much the same way, before diverging in mid-August (figure 1).

For the last five months of 2006, slaughter was up 16.5% on 2005 levels. The impact on price was dramatic. The Eastern Young Cattle Indicator (EYCI) peaked in mid-August, and as the dry set in, subsequently fell 25.1% to bottom out twice, in October and December.

We can’t really use a 25% fall as the benchmark for price declines in a dry winter or spring. But we can use the 90CL price, and the discount the EYCI reaches, to estimate how low prices might go. Figure 3 shows the long term EYCI spread to the 90CL Frozen Cow Indicator. Before the massive discounts of 2013-2016, the biggest the EYCI got to the 90CL was 20%.

Key points:

  • There are some concerns emerging on around dry weather which could possibly continue.
  • Historically a dry winter and spring has resulted in a strong increase in cattle supply.
  • If the EYCI moves to a historical dry winter/spring discount, values could fall by 130-150¢.

What does this mean?

Figure 3 shows a few dry winter/spring periods when the EYCI has fallen relative to the 90CL indicator. Currently the EYCI is basically at parity with the 90CL price, and a 20% fall would shave 130¢ off the current value. Based on the current 90CL price of 648¢/kg, a 20% discount would give an EYCI of 518¢/kg cwt.

If the EYCI falls into the low 500¢ it would be the weakest price in two years. There is also a chance the 90CL could fall, which would obviously mean cattle prices could weaken further.

It could rain, and cattle prices could hold on to current strong values, but if the rain holds off cattle prices will fall significantly. This could be good enough reason for some to take the money on offer at the moment.

Other comments:

Include here any additional information or specific comments to ensure successful upload by the web manager


Retail beef has found a peak

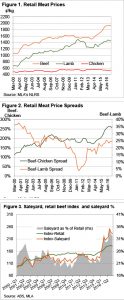
It doesn’t matter how tight cattle supply is, beef still lies on a demand curve, where consumers will eat less beef as prices rise. While Australian beef prices are largely governed by export markets, the domestic consumer is still our largest single market for beef. This week we take a look at the latest retail meat values, and what this might mean for cattle prices.

The Australian Bureau of Statistics (ABS) recently released their retail meat price indices, which Meat and Livestock Australia (MLA) convert to average retail values for the quarter. Figure 1 shows the latest retail meat prices, which shows beef and lamb prices easing marginally.

Retail beef prices peaked in the December quarter, hitting 1939¢/kg retail weight, but eased 1% in the March quarter, to sit at 1920¢ (figure 1). Compared to its major substitute, lamb, beef remains at a strong, but not unusual premium. For the last 18 months beef has ranged between a 22 and 25% premium to lamb at a retail level, which is the highest level in 9 years.

There is precedent for beef to move to a stronger premium to lamb, which has been as high as 38% back in 2000. Similarly, we have recently seen beef at just a 4% premium to lamb, back in 2011 when lamb prices has a serious rally.

Retail chicken prices gained 1% in the March quarter, but remains exceptionally cheap compared to beef, and to a less extent lamb. In the September 16 quarter, beef was at a 265% premium to chicken, and this has eased marginally to 257% in the March quarter. Chicken continues to take market share from the more expensive meats, but it’s promising to see retail beef prices managing to maintain high premiums.

Figure 3 shows that easing saleyard prices in the March quarter might have helped retail prices ease a little. However, looking at indices of the retail and saleyard prices, we can see that saleyard prices remain expensive relative to retail values over the long term.

Key points:

  • Retail beef prices eased marginally in the March quarter, but remain historically high relative to other meats.
  • Saleyard cattle prices have fallen further than retail values, which may provide a little support.
  • There is still a lot of room for saleyard price to fall without retail values moving, so there may not be much relief for consumers.

What does this mean?

Beef prices remain expensive relative to other meats at a retail level. Cattle prices remain expensive relative to retail values. This means cattle prices have plenty of room to fall. If saleyard price move back to 25% of the retail price, it puts the trade steer indicator at 480¢/kg cwt.

It seems unlikely retail beef prices will fall in a hurry. Even during the very cheap cattle prices of 2012-13 beef prices only edged lower, so hopefully, for producers, the 450-500¢ level might be the bottom of the range of beef prices over the coming years. Consumers are not likely to get much relief at the checkout however, and export markets will have to soak up any extra supply that comes through.

Other comments:

Include here any additional information or specific comments to ensure successful upload by the web manager