 It hasn’t happened to the Eastern Young Cattle Indicator (EYCI) yet, but we have a few slaughter categories which have moved below year ago levels. It’s been a while since producers were getting less money than the year before, in fact it’s been three years, but is anyone complaining?
It’s been nearly two months of cattle prices tracking sideways, as just as the market seemed to avoid the usual autumn decline, the winter rally is taking it’s time to appear.
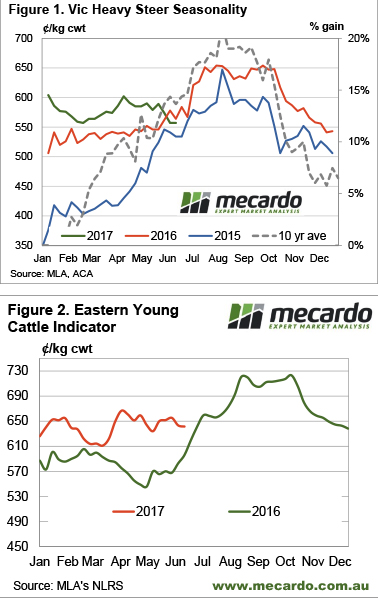
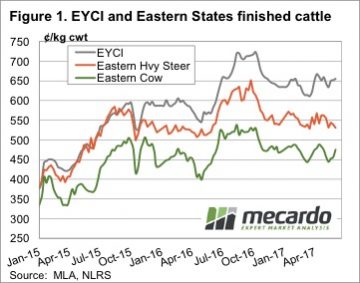
Figure 1 shows the Victorian Heavy Steer Indicator, which is a pretty good proxy for slaughter cattle on the east coast. Since 2015 there hasn’t been a week when the Vic Heavy Steer was lower than the previous year. In fact, we had to go back to February and March 2014 to find a time when the Vic heavy steer was lower than the year earlier. At that time the Indictor was at 310-320¢/kg cwt, just 5-10¢ below 2013 values. This week’s price was 557¢/kg cwt.
So is anyone complaining about prices? We can see from figure 1 that producers with heavy steer might be disappointed they didn’t sell a month ago, with the Vic Heavy Steer down 30¢ in that time. This equates to around $105/hd on a 350kg cwt steer, which hurts a bit.
In terms of the trade, if these steers were bought back 18 months ago, the EYCI was 600¢/kg cwt. Convert to live weight and add a bit of basis, and they might have cost around $1,000/hd at 300kg lwt. Selling this week as heavy steers they would have returned $1,950/hd. We’re not sure anyone is complaining about a $950/hd gross margin.
the week ahead
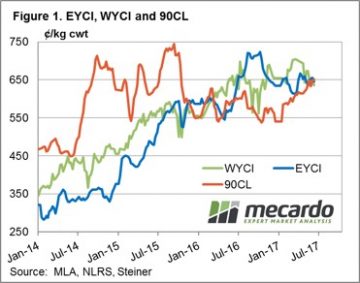
Seasonality suggests cattle prices are due to rally, and Matt’s analysis earlier this week on processor margins suggests there is room for slaughter cattle to begin their winter appreciation. Young cattle prices remain strong, as restocker and feeder demand is still robust enough (figure 2). We might see slaughter cattle rise without young cattle for a start. Although the very dry weather outlook for the next 8 days suggests we might be waiting a bit longer yet.

 The Eastern Young Cattle Indicator (EYCI) just 1.8% softer to close at 643.25¢/kg cwt. It’s Western cousin a touch heavier with a 2.3% fall to 635¢, while the key beef export benchmark 90CL frozen cow managed a slight 0.9% gain to 652¢/kg CIF – figure 1.
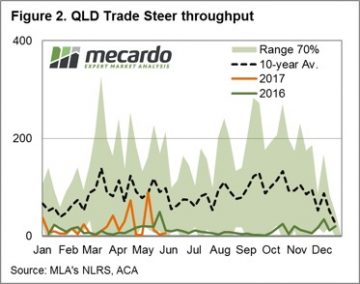 The sideways price action demonstrated by most cattle categories somewhat unsurprising given the broadly unchanged weekly slaughter and yardings numbers. East coast slaughter for the week ending 2nd June only 83 lower than the prior period and just shy of 136,000 head. East coast yarding posting a 1.8% gain on the week to see 54,940 head change hands – figure 3.
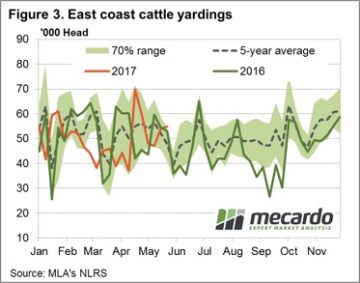
 The fundamental international market news was bullish this week, but markets seemed to focus more on local issues. Broader indicators managed hold their ground, or even rally a bit, but at the state level there were some heavy price declines.
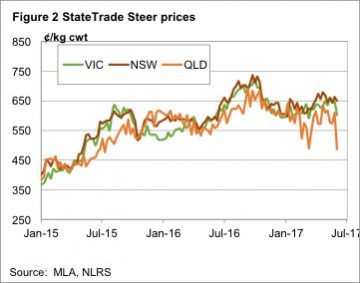 Restockers pushed the EYCI higher, as shown in figure 1, it gained 4¢ for the week to hit 655.25¢ a five week high. Cows also rallied, while heavy steers fell.
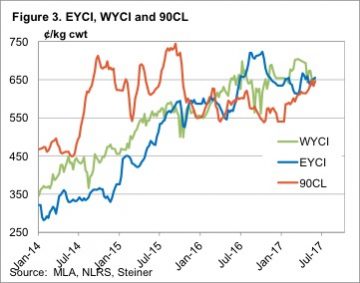 In WA the Western Young Cattle Indicator (WYCI) gained a couple of cents to sit at 650¢/kg cwt. Figure 3 shows an interesting convergence. The EYCI, WYCI and 90CL indicator all sitting between 645 and 655¢. The last time we saw this was in March 2016.
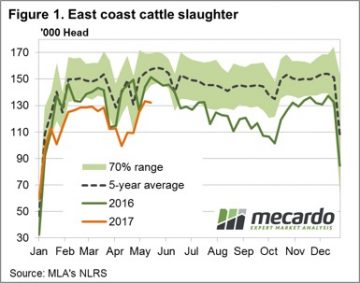 East coast slaughter, for the week ending 19th May, recording a marginally softer result for the week at 132,392 head – figure 1. Most of the East coast states registering a decline in slaughter, although as figure 2 shows NSW slaughter still peaking for the season with 32,268 head recorded. NSW slaughter likely to start the seasonal decline from here though as supply tightens into the Winter period.
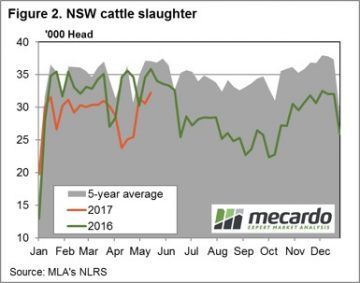 Most national categories of cattle price movements were pretty uneventful this week, although Medium Steers dragged down by SA figures. The National Medium Steer closing the week 4.6% softer to 292¢/kg lwt, Queensland Medium Steers unchanged at 286¢ and NSW/Victorian Medium Steers only 2-3% softer. The killer punch for the national figures coming from SA Medium Steers, down 14.9% to 294¢/kg lwt.
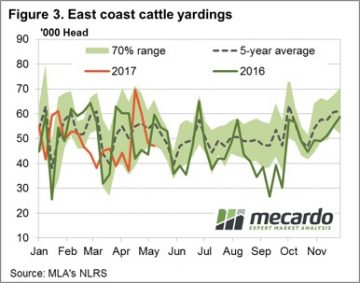
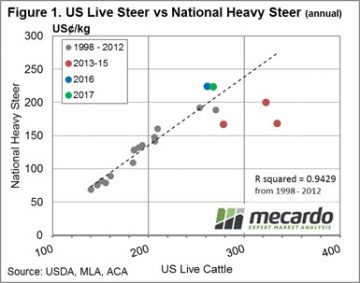 Just as there is a reasonably strong correlation between the annual average EYCI price and the annual average 90CL beef export price, the same holds for annual average prices for US Live Cattle and National Heavy Steer prices. Indeed, as highlighted in figure 1, annual price data for both series converted into US¢/kg from 1998 to 2012 demonstrates a very close relationship. Clearly, the poor seasonal conditions and high turnoff locally for cattle during 2013-15 had an impact on local Heavy Steers prices, remaining in undervalued territory for much of the period (red dots below the line of best fit).
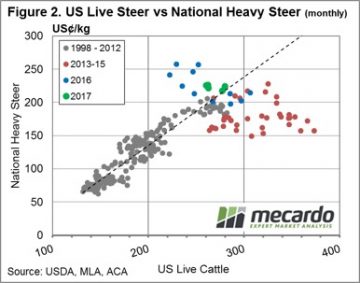 This situation can be seen more clearly by taking a look at the monthly average price comparisons between US Live Cattle and Heavy Steers – figure 2. Interestingly, recent improvements in US Live Cattle prices during March/April 2017 have meant that local Heavy Steer prices are much more in line with what could be considered normal long term levels, as identified by the green dots for the 2017 season moving closer toward the line of best fit.
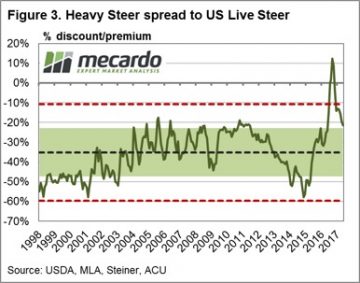 Currently the rebound in US Live Cattle Futures has seen the discount spread return to just above the top of the “normal” range at around 21% discount. While still some way off from the longer-term average spread discount of 35%, it has taken some of the topside pressure off local Heavy Steer prices that would have been evident when the spread was sitting at a premium during late 2016.
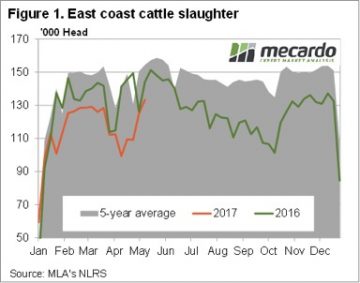 Figure 1 shows that east coast cattle slaughter reached its strongest level since December in the week ending the 12th of May. It’s interesting that this is around the time cattle slaughter traditionally peaks, as cattle out of Queensland bolster stocks.
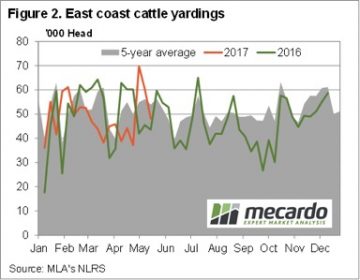 While it is difficult to envision the EYCI getting back to 700¢ this winter, the 90CL export price is doing the right thing, having rallied to 650¢/kg cwt. In fact, the EYCI and 90CL are back at level pegging for the first time since this around this last year.
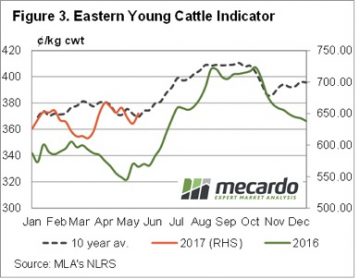
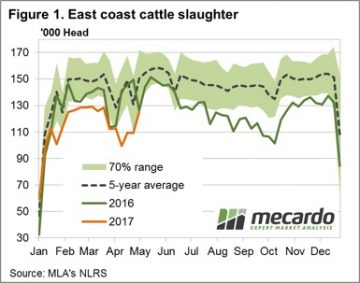 In contrast to the declining throughput and price movements, weekly East coast slaughter for the period ending 5th May still managing an increase from the previous week’s numbers as processors increase activity post the shortened Easter and ANZAC holiday periods – Figure 1. Weekly cattle slaughter rising 14.5% to just over 125,000 head, not far off the peak slaughter levels experienced during March.
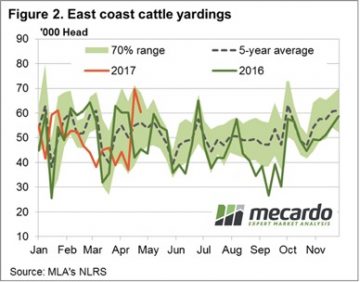 Indeed, the Western cattle markets were broadly stable, while only marginal declines cited in the East for young/store cattle. The EYCI down a mere 1.5% on the week to 634¢/kg cwt – figure 3. In national markets, trade steers less than 1% softer (345¢/kg lwt), feeder steers declined 1.8% (342¢/kg lwt), while medium cow shed a mere 2.1% (216¢/kg lwt). The more moderate falls reserved for the heavier end with medium steers leading the charge recording a 5% fall at 292¢/kg lwt, while heavy steers (not so heavy it seems) posting a 2.6% drop to 293¢/kg lwt.
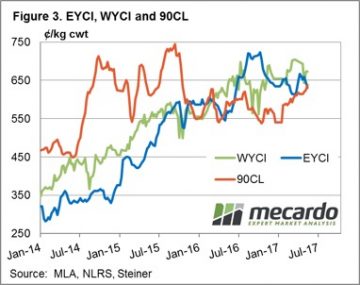
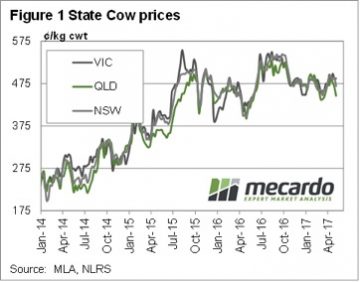 The current margin on cows for processors comes in at negative $34 per head. The margin model is based on a cow weighing 500kgs liveweight, or 260kgs carcase weight. Basically the loss being worn by processors at the moment equates to 13¢/kg cwt.
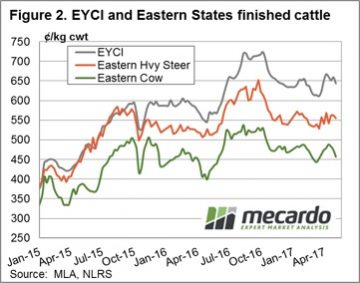 In fact, prices in Queensland are nearly there, sitting at 446¢/kg cwt last week (figure 1). There is still upside potential for cow prices over the coming months, with the prospect of tight supply sending processor margins toward the $150 losses seen last year. To reach these deeply negative margins under current beef prices, cows would have to make 520¢/kg cwt. Last winter and spring cows were making 540¢, so this is not out of the question.
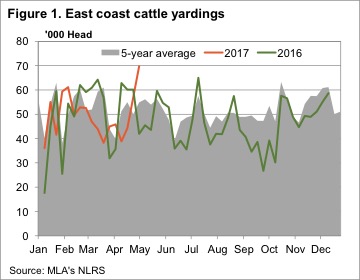 Figure 1 shows east coast cattle yardings rallied an enormous 87% on last week, and 52% on the last full week of sales. With yardings this week hitting 69,737 head, we had to go back to the second week in December 2015 to find larger supply.
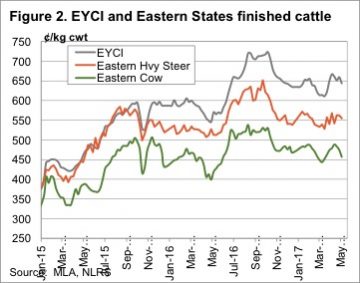 There were no issues with supply hitting prices in WA, where the Western Young Cattle Indicator rallied 30¢ to 673¢/kg cwt. Supply tends to only get tighter in WA at this time of year, which should keep prices at the upper end of the range.
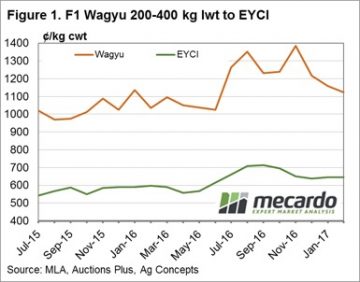 As it is international Star Wars day (May the fourth be with you) and the Australian Wagyu Association’s conference being held in Albury this week we couldn’t resist both the pun and the focus on Wagyu premiums over comparable young cattle, based off the Eastern Young Cattle Indicator (EYCI) underlying data.
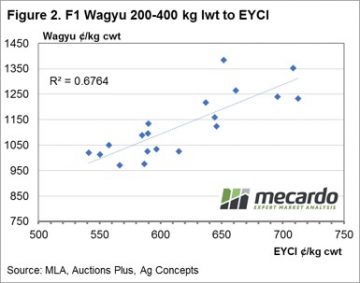 An analysis of the percentage spread that has been achieved by F1 Wagyu cattle within the same weight range of EYCI cattle shows an average premium of 83% has been attained since July of 2015 – figure 3. Although the percentage spread can vary at any given time the 70% range between a premium spread of 72%-94% (green band) highlights where the series has fluctuated for 70% of the time. The two red dotted lines between 61% to 104% give an indication of the 95% range (two standard deviations away from the average for the statistically minded reader) and gives an indication of when the spread is nearing historically extreme levels.
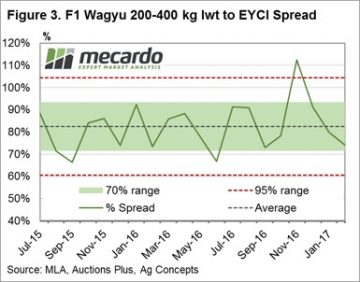 On average, the F1 Wagyu producer can expect to receive a premium spread between 75-95% above the EYCI most of the time. Recent discussions with Wagyu F1 producers indicated that forward basis agreements had been under negotiation with processors to determine an EYCI plus an agreed percentage spread as a settlement price when cattle were due for delivery. This historical spread analysis will give an idea of what type of premium for F1 Wagyu cattle above the EYCI is within a fair and reasonable range.