Category: Grain

Crimea river.

This weekend Russia and Ukraine edged closer to war. Many may recall the short conflict between Russian and Ukraine in 2014 which provided a short rally in pricing. In this analysis, we look at what the impact could be if this conflict was to escalate.

On Sunday a Russian naval vessel opened fire on three Ukrainian vessels, detaining them and causing injury to six sailors. The incident occurred in the Kerch Strait, which is a contested area between the Azov and Black sea (see map).

There is an agreement that both countries will have entry through this strait to access their respective ports on the Azov sea. However, in the past year, there have been concerns from both sides regarding inspections of vessels which have slowed down trade in this area.

In early 2014, Russian back separatists fought against Ukrainian forces which resulted in Crimea being annexed by Russia (see map). This has led to a tense environment with fighting continuing albeit largely forgotten about by the rest of the world, despite estimates of 10,000 being lost in the conflict in recent years.

During the initial period of the 2014 conflict, risk premiums emerged within the agricultural markets. However, when it was realized that supply chains would be largely unaffected the market fell back.

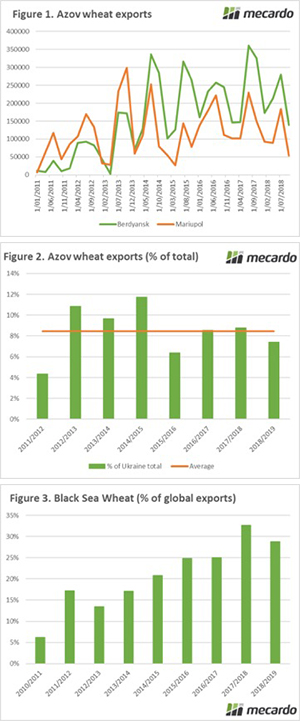
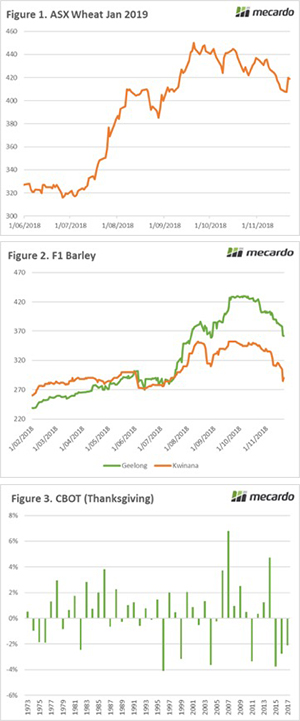
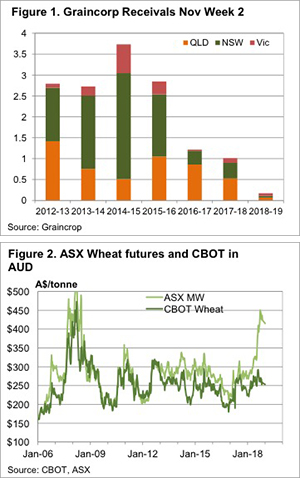
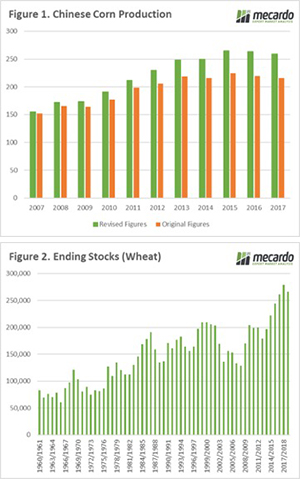
The main ports on the Ukrainian side of the Azov sea are Mariupol and Berdyansk. These ports are mainly used for the export of steel and grain. The drafts at these ports limit the volume which can be exported. The quarterly exports from both ports are shown in Figure 1, with annual exports at 1.1mmt.

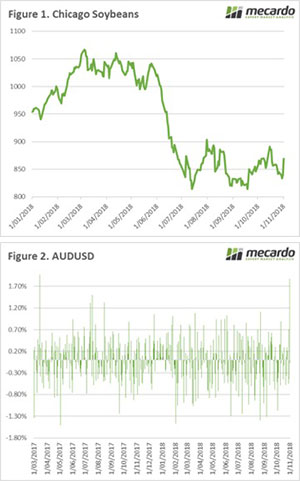
It is important to note that that majority of Ukrainian exports are loaded on the black sea, which is not likely to be disrupted by the current tensions. On average the Azov ports load around 8% of Ukrainian wheat exports (Figure 2).

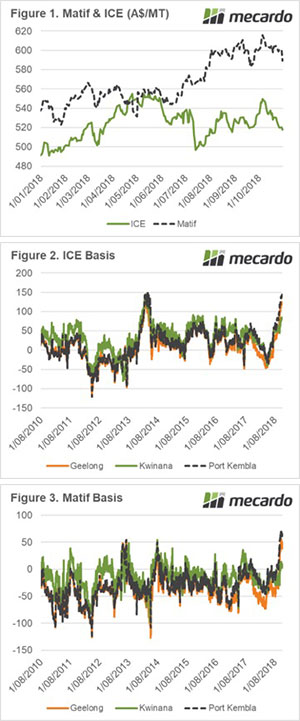
The risk is limited at present, whilst the tension is restricted to the Crimea and the Kerch Strait. However, if there is an escalation of hostilities, the disruption could spread to the black sea ports. It is important to remember how vital Russia and Ukraine are to global wheat exports. In this season it is expected that Russia and Ukraine combined will contribute 30% of the global export task (Figure 3).

What does it mean/next week?:

An escalation to a full-blown conflict is highly unlikely at present and not in the best interests of either country. However, all eyes will be on Putin and Poroshenko in the coming days and weeks.

The international community have expressed concerns with the Russian behaviour, however, it is unknown how much pressure the west can really exert.

In the event of major disruption to the black sea grain trade, there is likely be very strong premiums enter the market, especially considering the reducing global exportable surplus.

Key Points

  • Russian naval vessels attacked and detained three Ukrainian vessels in the Kerch Strait.
  • The ports likely to be impacted at in the Azov sea; Mariupol and Berdyansk.
  • These ports load on average 8% of Ukrainian wheat exports.

Geopolitics at the fore.

It’s been an interesting week, with geopolitics front and centre. Early in the week, we had a fracas between Russia and Ukraine and today the leaders of the world meet for G20 talks. In this comment, we look back at the big drivers in the market.

This weekend the leaders of the G20 will meet in Buenos Aires. This could be a very interesting meeting, with the US-China and Russia-Ukraine issues being a considerable talking point. The market has reacted to the potential for positive discussions between Trump and Xi with Soybeans up 3% or 24¢/bu (Figure 1).

The US soybean market has fallen dramatically since China announced tariffs against imports, which in turn resulted in Brazilian exports trading at a strong premium to the US. There are expectations that positive conversations would lead to a relaxation of the current tariff structure.

Chicago wheat futures fell to end the week down 2% or A$8.9/mt (Figure 2). The concerns of distribution to trade flows in the black sea have largely been removed from the market (see Crimea River), as ports in the affected region on export <10% of the Ukrainian crop.

The planted area for the 2019 wheat is expected to be high. Russian winter plantings are expected to reach record levels this season, which although there is a long time until harvesting does point towards the potential for another strong year of production.

Due to the China-US tariff scuffle, soybeans are being held in storage which is becoming a concern for prices during the 2019 season. It is expected that after a 100 year low in wheat planting for last year, we will see a resurgence of wheat acreage.

In the past week, local prices have risen whilst Chicago has dropped, therefore providing an improvement in basis levels (Figure 3). At present, farmers are reluctant sellers, especially with the stop-start harvest that we are currently experiencing.

It is important to remember that these basis levels (or premiums) over Chicago are very strong (see This isn’t the new level). As grower selling starts to increase we may see a decline in premiums, albeit still remaining at historically high levels.

What does it mean/next week?:

If we see a positive meeting between Xi and Trump, we are likely to see a positive impact on markets. There are concerns that continued tariff restrictions between China and the US will have wider economic ramifications, an easing of the tariffs will lead to increased confidence.

Does the forward curve support producers or consumers?

Does the market structure at present offer an opportunity for producers, consumers or both to reduce their price risk for the 2019/20 harvest? In this article, we examine both local and overseas futures to provide some options for hedging.

It is always of great importance to look beyond the current harvest and towards the horizon. This is equally important for both producers and consumers.

The bulk of the wheat price received in Australia is the futures element, with the predominant contract being the Chicago contract (CBOT). In a typical year, basis would account for around 30% of the overall price, in a drought year like present, this will increase substantially.

The forward curve remains in contango, where forward contracts are at a premium to spot. At present, the December 2019 contract is at A$276, a A$22 drop from this time last month (Figure 1). This is clearly less attractive for hedging for growers, however, it does provide a much more attractive opportunity for consumers.

This is the lowest level since mid-July, providing a solid floor to start the procurement process for the 2019/20 season. There is a long way to go between now and next harvest and hiccups in the northern hemisphere could lead to substantial price rises. This is especially true during the northern hemisphere risk period where we have seen strong movements in recent years during the mid-year (Figure 2).

What about for producers? In mid-August, I highlighted the opportunity for producers to hedge using ASX for Jan 2020 (see article) and also how this strategy could be used by consumers (see article) in September. At this time, it was possible to lock in A$380 for January 2020. I know that several producers did follow this strategy and the market has now fallen to A$330 (Figure 3). This provided an effective return of A$50p/t.

The market is clearly not as attractive now for producers as it was a month ago, however, A$330 still provides a reasonable base for hedging. This is still a return higher than in recent years.

I generally opt for a risk mitigation strategy where the marketing process is conducted in chunks. This leaves room to continue to participate in any upside, but also not been completely exposed to a market trending downward. It comes back to the old saying, how do you eat an elephant? One bite at a time.


What does it mean/next week?:

The market is currently offering potential strategies for both producers and consumers to reduce their price risk for the 2019/20 season.

The market is very volatile, with local and international conditions for next year on a potential knife edge. No-one knows where the market will be in >12months time, therefore it is prudent to consider strategies to reduce risk, even if only biting a small chunk.

Key Points

  • December 2019 Chicago futures are down $22 to $276 from this time last month.
  • ASX futures for January 2020 have lost some shine falling A$50 to $330 from highs in September.

Thanksgiving or thankstaking?

The USA was closed on Thursday for thanksgiving celebrations. This meant that the market was relatively quiet ahead of the holiday, so the focus on this week’s market comment will be on the local market.  

The ASX wheat futures market started the week in the red, as yields surprised, and consumers pulled out of the market. However, on Wednesday afternoon strong trading resulted in the market rising 2% since the previous Friday (figure 1).

The barley market took a turn for the worse this week. On Monday it was announced that China was launching an investigation into allegations of Australia ‘dumping’ barley in an uncompetitive manner. Earlier this year an investigation into US Sorghum dumping led to a 178% bond, this resulted in Australian sorghum becoming more competitive. However, a month later China removed the requirement to pay a bond.

Although prices had been steadily falling since mid-October, the trade reacted strongly to the announcement. This resulted in Barley prices falling across the board (figure 2). Western Australia took the bulk of the hit with prices down 7% week on week and 5% decline in Geelong.

The investigation is expected to last up to 12 months and if a bond is introduced, Australian barley for export will be uncompetitive into China which is overwhelmingly our largest customer.

Prior to thanksgiving volume on Chicago futures tends to dip as traders pull their positions ahead of the holiday. However, what happens when they come back to work? In the past 44 years the market has risen on the first trading day after thanksgiving on 26 occasions (figure 3). Overnight an Egyptian tender was partially filled with US wheat, which will likely give some support for futures when they open.

What does it mean/next week?:

How will the market react as harvest continues? At present it is a Mexican standoff, where buyers hold off and growers store their grain.

There has been strong rainfall in NNSW which will assist with the summer sorghum crop. Although there is still a long way to go until it is harvested, this does provide some confidence.

Harvest pressure despite minimal receivals

With harvest underway yields are coming in near expected levels.  Looking at receivals gives us a bit of an idea where grain is being stored, and where the top ups are coming from. ASX Futures also suggest a bit of heat is coming out of the market.

Figure 1 paints a pretty stark picture of how yields are faring early in the harvest. With reports that the Northern NSW and Queensland harvests are basically done, just 170,500 tonnes have been received by Graincorp. A third of receivals have been in Victoria.

Compared to the same week in previous years Graincorp receivals have been minuscule. The way things are headed it looks like it will be hard for Graincorp to receive 1mmt this year. Total receivals last year were 5.58mmt.

Bulk handler receivals aren’t necessarily an accurate reflection of the crop size.  We don’t think that the east coast has harvested just 17% of what was harvested to this week in 2017. Most of the grain harvested this year is likely to be stored on farm or delivered direct to consumers.

It’s interesting to note that Graincorp are reporting ‘Transshipments via port’.  We suspect this is grain which has arrived from WA or SA, which is up to 192,000 tonne.  More grain has come in via ship than has been received up country.

Harvest both in the east and west does seem to be putting some pressure on prices.  ASX East Coast Wheat has fallen another $10 this week to $415/t (Figure 2), while ASX Feed Barley is quoted at $383/t.  Chicago Wheat is also close to a six month low in our terms, Dec-18 is back at $252/t in our terms thanks largely to a rising Aussie dollar.

What does it mean/next week?:

Weather is going to be good for harvest in WA over the coming week, while the east coast might see some delays. With harvest and hopes of a summer crop taking some pressure off markets it will be interesting to see what level growers stop selling at. Some support should be found at $400 for wheat, it’s a nice round number.

What in the ag markets changed 254.7% overnight?

Recently there have been releases from both the US Department of Agriculture (USDA) and the National Statistics Bureau (China). There were some very, very big changes to headline numbers.

I have rightly or wrongly always been dubious of supply and demand numbers originating from China. The data reporting does not appear to be as rigorous as other nations and it can be very difficult to obtain a strong handle on what is happening on the ground.

The National Statistics Bureau has revised Chinese corn production from 2007 to 2017 based on census data. This has resulted in large amendments, with production over the period increased by 259mmt (Figure 1). To put this in perspective, China has found 23.6mmt on average over the past decade. Coincidentally, this is the average Australian wheat production for the same period.

The USDA released their November World Agricultural Supply and Demand Estimates (WASDE) overnight. The USDA reflected the change and increased Chinese corn ending stocks by 254.7% between the October and November update. The overall global picture for corn stocks is 307mmt, versus 159mmt one month ago.

If these numbers are truly reflective, then this will reduce China’s need to import corn during this season, or at least until the mandated 10% ethanol in fuel regulation is implemented.

Wheat was also given the bearish treatment, with global end stocks increased by 6.5mmt. This would place world ending stocks at the second highest on record (Figure 2). As ever, we must be cognizant of the fact that 53% of world stocks are held in China and are unlikely to be available to the world market.

The Australian crop was reduced from 18.5mmt to 17.5mmt, which remains above trade estimates. There tends to be a two-month delay in the USDA expressing a change in Australian wheat production from what is happening on the ground. In the December update, it would be unsurprising to see a further reduction to 16.3-16.8mmt. However, this will already be taken into account by the market.

What does it mean/next week?:

As harvest rolls will we get more surprises or will harvest selling pressure bring some downside to pricing?

There is some light rainfall expected for most of the east coast in the next 8 days, which will be positive for the sorghum crop.

Xie Xie Trump.

Social media continues to be an influencer in markets. In the last day we have seen big moves in the market in response to a tweet made by President Trump regarding China. In this week’s comment, we take a look at the markets it has influenced.

Donald Trump announced (through twitter) positive discussions with his counter part in China, Xi Jinping. During Trump’s election campaign, he had alluded to his desire to change the trade relationship with China. This resulted in the announcement of various tariffs by the US and counter escalations by China.

The biggest impact to the US was with agricultural products, especially soybeans. This resulted in US soybeans becoming uncompetitive versus other origins. This was covered in the article ‘What do US soybeans and the Socceroo’s have in common?’.  The Trump tweet has resulted in expectations that positive trade talks would result in an improvement in soybean exports which have been languishing of late. This resulted in strong rally in soybean prices (figure 1) of 4%.

It is important to note that at this stage, the relationship could easily change direction with little notice. As we have seen, the US president has been volatile at times. It’s not over yet.

Yesterday the A$ rose 1.87% rising from 0.7073 to 0.7205. This was its biggest daily jump since March 2017 (figure 2). The expectations of a thawing relationship between Trump and China, along with a positive Australian trade balance for September which was strongly above expectations.

The increase in the A$ technically makes Australian wheat less competitive from an export point of view, however at present we are well above other origins at present. The stronger dollar will provide some benefits for imported products.

What does it mean/next week?:

Trump could easily change his mind and go stronger against China. This would result in any gains and positive sentiment being lost.

The USDA will released their WASDE report next week, giving an indication of the final results of the season from the northern hemisphere.

This week also saw an increase in US wheat export sales (582.5kmt vs exp 200-500kmt), will we see this repeated for a second week?

Canola & Rape futures.

Canola is starting to be harvested but a cloud hangs over the industry. With a massive hay program and dry finish, what will happen to yield and oil content? In this analysis, we take a look at canola basis versus Canada and France.

Two weeks ago, we wrote about canola pricing catching up with the drought conditions in the article “Canola: Finally catching up”. This week we will take a look at the canola futures market.

There is an Australian canola futures contract on ASX. However, it has no trading activity, therefore it is ineffectual. Farmers who are hedging using financial price risk management tools will then have to look overseas for a market.

If we are ignoring local derivatives, the main contracts are Canadian Canola futures (ICE) and French Rapeseed (Matif). The Matif contract is non-GM, whilst the ICE contract is GM.

In Figure 1, the Matif and ICE spot contract is displayed in A$/mt. The Matif contract rose through July-September as drought conditions impacted upon the German and French crops. The ICE contract also followed the general market. However, in recent weeks, the market has lost much of its momentum and is sitting below the average from Aug-Nov.

The drought in Australia has drastically impacted canola production, therefore we would expect that the local premium (basis) against overseas futures would rise dramatically. In Figure 2 & 3, the basis between ICE and Matif is shown. Recent weeks have seen a sharp rise in basis levels over both contracts.

The premium over ICE is at the highest level since 2014 and is the highest against Matif during this decade. Typically, when these peaks are reached the market tends to experience a correction, but will this be the case this year?

What does it mean/next week?:

A high basis level usually suggests that it is time to start selling physical. However, a huge amount of uncertainty remains around canola production levels (& oil content). The east coast has a likely deficit of supply which will place pressure on crushers as they move into the new year.

The risk of seed imports is low, however, oil consumers can easily switch to imported canola oil to meet their requirements.

I am confident of strong prices into the new year, however I would advocate for a bite sized selling program as the seed comes off the header.

Key Points

  • Canola prices have risen dramatically in the past month.
  • The price increase is attributed to local
  • Basis levels against both ICE (Canada) and Matif (France), are at their highest levels since the start of the decade.

The hunt for the red October.

This week the market continues its volatility with prices falling globally and domestically. The main factors driving the market into the red has been the Russian crop beating initial expectations and reducing the likelihood of export curbs.

The Chicago futures market has ended the week on a low note. The past week has seen futures fall A$12 since the close last Thursday (Figure 1). The trade is concerned about the increased expectations of the Russian crop and decreased exports in the US. The fall in the overseas market will certainly impact local pricing. The low expectations of Australian exports will, however, be limited, as local drought factors dominate.

Throughout the past few months, there have been concerns related to this seasons wheat crop in Russia. There were headlines discussing the huge drop in production (>15%) year-on-year. Throughout the year we have urged caution, as this number is from the record production year.

The crop has performed above many expectations and is now projected at between 70-72mmt, this is the third largest crop (Figure 2). It is important to remember that although this crop is 15% lower year on year, it is 26% above the average.

At a local level, the ASX contract has lost steam, with January 2019 falling back 3% or $20 in the past week (Figure 3). The strong potential for the summer crop has given buyers some confidence and many are selling their long positions at what are historically high levels.

In recent days, there have been frosts in the western districts of Victoria, the last region of mainland Australia with a decent crop. It is too early to determine the extent of any damage, but in impacted regions, it will reduce the likelihood of any further growers selling whilst the risk is assessed.

The week ahead

The trade will be assessing the progress of harvest as we move into November. It will be interesting to see if grower selling places pressure on basis.

There is more rain expected in the north which will further assist the summer crop. Let’s just hope that the good fortune continues.

A royally good down pour is the Prince-iple talking point in the market.

Grain producers in NSW and QLD have been constantly harried this season, as promising weather forecasts fizzled to nothing. So far October has received the crown for rainfall in many places which has provided much-needed confidence to summer croppers (and consumers).

The Chicago wheat market has closed the week with three straight losses. The rapid pace of Russian exports is pressuring US values (Figure 1). There were concerns throughout the past three months that Russian production would be poor and would result in export curbs. However, this seems increasingly unlikely as the estimates place the crop at either their 2nd or 3rd largest wheat crop.

It is likely that export demand will switch to the US in late 2018 / early 2019 as Russian supplies dry up.

The Russian government is also in the process of selling their stockpiles to the domestic market and have announced that they will not purchase any 2018 harvest wheat. This is not necessarily an issue for Russia at present, however, a poor 2019 will require them to enter the market to support domestic consumers.

At a local level, the recent rainfall has grabbed the attention of the trade. In the past week, many parts of NSW/QLD have received >50mm, this has provided a degree of confidence in the summer sorghum crop.

The BOM has forecast similar downpours over the next week, this will encourage paddocks with previously lower moisture profiles to support planting. At present acreage available for seeding is very high, however there are concerns around seed availability. Despite the positive outlook there is still a long way to go.

The positive sentiment led to the ASX contract sliding A$8 or 2% (Figure 2). The next month will see more surety of the crop with the full extent of the impact the dry September and frost has had on the crop will be determined. The range of estimates from the crop range from <10mmt to 16mmt, clearly a surprisingly low number will cause prices to rally.

What does it mean/next week?:

Harvest is in progress in parts of the country. The reality is that crop forecasts are a very inexact science and the reality will be unveiled when the lie detectors get into the paddock.

The big focus of the next two weeks will be whether the forecast rainfall eventuates. If realised, it will provide some comfort to summer crop producers and many grain consumers.