Category: StockCo News

Rain on the plain sees cattle price gain

Cattle markets have been waiting for a rain event, and it keeps coming.  Average January rainfall has been followed by more rain in Queensland this week, and more is forecast for the east coast this week.  If the drought hasn’t broken, price action suggests it is not far away.

The Eastern Young Cattle Indicator (EYCI) this week tore through 600¢ and finished Thursday at 623¢/kg cwt.  Restockers continued to drive values higher, averaging over 350¢ for steers in NSW and Queensland.  Feeders joined in this week, paying over 340¢/kg lwt for steers, 21¢ higher for the National Indicator.

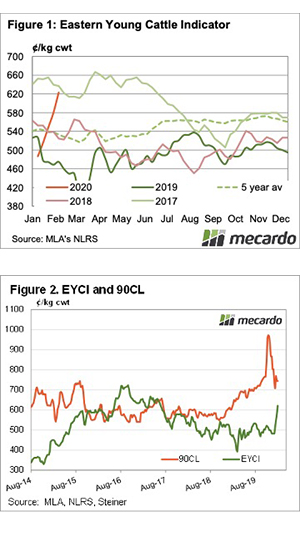
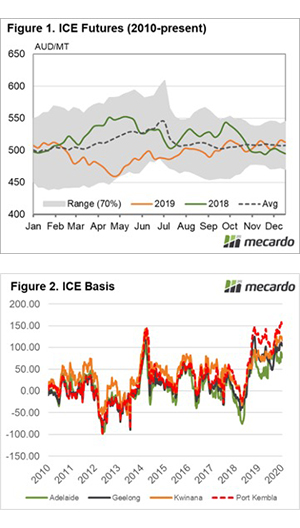
Figure 1 shows the EYCI hasn’t been this strong since mid-2017, and it hasn’t seen a better than 100¢ increase in a month ever, as far as we can tell.

While Trade Cattle remained stubbornly steady at 300¢, Heavy Steer and Cows joined in the rally, the National Indicators sitting at 319 and 258¢ respectively this week.

Over the Hooks prices have also started to move, on average they were up 20¢ cwt at the start of the week and given they are still behind saleyard values, they might have to lift a bit further to get many bookings.

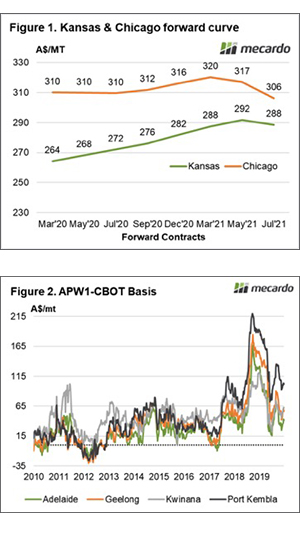
Export prices have continued to yo-yo this week, with the 90CL Frozen Cow Indicator easing 25¢ back to 744¢/kg swt. The price still leaves room for cattle prices to rise (figure 2), but the rally might start to slow.  That’s not to say it will stop, with 700¢ for the EYCI a realistic target.

Next Week

Meat and Livestock Australia’s cattle industry projections were released this week, so next, we’ll be looking at some long term forecasts.  Needless to say, things look very positive for cattle prices, with cheaper feed finally on its away and restocking on the minds of many in NSW and Queensland.

Are we independent?

Is the Australian grain industry a lone continent removed from the vagaries of overseas pricing? Are we independent of the rest of the world? In this article, we take a look over the past few months to see the driver of pricing.

Derivatives play an important part in pricing grain, even if you do not use them to manage your risk – the derivatives market will impact the price that you receive. In recent weeks we have heard from many that futures aren’t important because our pricing is disconnected from the rest of the world.

In figure 1 the change in price (as a %) is shown for four ports in Australia and the CBOT price. As we can see the price movements onshore and offshore are following one another quite closely.

These ports show a strong correlation between CBOT (in A$/mt) and the local port price. The correlation since the start of harvest is shown below, with 0 being no correlation and 1 being a perfect correlation.

  • Adelaide 0.95
  • Geelong 0.91
  • Kwinana 0.95
  • Port Kembla 0.91

The basis levels in Australia have traded within quite a narrow range since the Christmas break. The pricing levels in Australia have moved higher through January and with a relatively unchanged basis, we could argue that much of that has come from the rise in futures.

What does it mean/next week?:

The correlation between overseas futures, in this case, Chicago, are strong. This means that if prices move in CBOT, then the local price will likely follow.

The importance of futures cannot be stressed enough therefore it is worthwhile including them in your risk management strategy.

Bunch of pluviophiles

The rain has fallen dramatically over the past week providing much-needed rainfall to large swathes of New South Wales and Queensland. This will provide some positivity to many after suffering through 2 or more years of drought.

CBOT December wheat futures have declined rapidly from their recent (and contract high) of A$318/mt on the 21st of January. At present, the December contract is trading at A$309/mt (figure 1). The contract price in A$ terms has been protected somewhat by a declining A$, however, even with a close to A$10 fall, it remains at strong levels compared to recent years.

At present, the futures price offers producers a favourable starting point for marketing next years crop.

Tentatively we can say that the drought has broken in many parts of the eastern states. After receiving scant rain over the past 2 (or more) years, the past month has provided saturating drenches.

These rainfall events start to provide some confidence of the coming crop and some surety of producing something. Albeit we need to remain level headed as we have seen promising rains in the past with no follow-up.

It’s important to remember that basis levels which have been extremely strong in recent times will cause our ‘premium’ over overseas values to decline. This may be experienced with increased vigour in relation to new crop pricing.

In figure 2, the basis level as a percentage of the overall physical price in Australia. In recent months the overall importance of basis has diminished. As a percentage of the overall price received in Australia, the basis is actually now close to the historical long term average.

What does it mean/next week?:

Next Tuesday the WASDE report will be released by the USDA. The USDA has commented ahead of the report that the Phase 1 trade deal details will not be included as part of this report.

The phase 1 deal was always going to be a tough target for China to achieve. The team of analysts at Mecardo do not believe that China will be able to meet this target, especially in light of continuing economic concerns related to coronavirus.

Coronavirus – impact on grain?

Coronavirus is spreading around the world at a rate of knots. In the last week, we have been asked about the potential impact on demand for agricultural commodities due to this illness. In this report we look at the question – is coronavirus impacting on demand?

The Coronavirus has spread from Wuhan, China to 18 countries in a very short period of time. This has caused a great deal of consternation around the globe as countries enact quarantine protocols. Does this impact on markets?

I thought it was useful to give a few pieces of disease trivia:

  • Spanish flu (1918-1920) is estimated to have killed up to 100m people or approximately 5% of the population.
  • The black death killed up to 60% of the population of Europe, and it took 200 years to recover the population to pre-outbreak levels.
  • SARS (2002-2003) infected 8098 people with 774 deaths.

As the number of disease cases increases the number of deaths follows. The daily increase in cases has averaged 60% since the outbreak started.

The mortality rate from coronavirus has averaged 2.6%. To put this in perspective 2019 was considered an exceptional influenza season, and the mortality rate was 0.19%.

In figure 1, we have modelled the potential death toll from Coronavirus using an infection rate of 60% per day and a mortality of 2.6%*. This chart shows the actual and the modelled death toll. The model when back tested has closely matched the data originating from China.

If the outbreak continues to follow the trend, then 2000 people will have died by early next week.

In recent days there has been lots of talk about reduced demand due to this outbreak. In figure 2, the grain consumption per capita for China since 1960 is displayed. In this decade the average consumption within the nation (all uses) has averaged 354kg/hd, which is above the global average of 335kg/hd.

At this level, if 10m people were to perish due to coronavirus, demand would drop by 3.9mmt. Global trade flows are more likely to impacted by supply issues, as an example the average production of grain (wheat, barley & sorghum) in Australia this decade was 34mmt, last year we produced 24mmt.

*As the outbreak progresses we are likely to see infection rates and mortality dropping.

Remember to listen to the  Commodity Conversation podcast by Mecardo

What does it mean/next week?:

The real drive down in price is most likely due to a risk off attitude, in conjunction with concerns related to the overall economic situation in China.

The real fundamental demand hasn’t at present changed. If we get to the level where deaths cause demand disruption, we will likely have more pressing concerns than the grain price.

Are you on ICE?

The canola market has seen a surge in pricing levels since harvest commence. This has been beneficial to producers who generally wait until harvest before selling their canola. In this update, we take a look at the basis between ICE canola futures and local pricing.

There are two main canola futures contracts ICE (Canadian canola) and Matif (French rapeseed), in this update we will be taking a look at the basis between ICE and Australian pricing levels.

Canada is an important canola producer, with the country producing on average 28% of the world’s canola crop over the past five years. Most of the canola grown in Canada is genetically modified, whereas the majority of the Australian canola crop is non-gm.

In a typical year Australia will export the majority of the Canola produced, which aligns itself well with the logic behind using ICE futures as Canada follows a similar trade flow.

In figure 1, the seasonality is shown for ICE futures (converted in A$/MT). In these seasonality charts, rather than use a min/max for the seasonality banding (green shaded area), we use a 70% range (or 1 standard deviation). The 70% banding is used to remove the extremes in the marketplace, which we believe gives a better indication of the seasonality, as opposed to a min/max which can be extremely volatile. In these charts, we also overlay the average for the timeframe and the recent seasons.

During mid-year of 2019 ICE canola futures traded at the bottom end of the range, however, they have drifted higher throughout the year albeit are only now trading at the average for the past decade. If we follow the seasonality, we tend to see the largest rises in the middle of the year. This corresponds with the northern hemisphere weather risk period, and a similar pattern is evident in wheat.

In figure 2, the basis between ICE and local canola prices is displayed. As we can see the local price has increased versus the rest of the world to record levels (Port Kembla). At present basis, levels are extremely strong. The strength in basis levels is due to scarcity of supply, and we shouldn’t expect to see these levels repeated in 2020/21 unless we see further supply shocks locally.

Remember to listen to the  Commodity Conversation podcast by Mecardo

What does it mean/next week?:

The Australian market is currently trading at very strong premiums to Canadian canola futures. It is highly probable that these basis levels will decline next harvest (if we have an average crop).

At present, I recommend using physical sales of canola, whilst the market remains strong.

A great start to your 2020 grain marketing

The price received in Australia is composed of futures & basis*. It is possible to lock in the futures component through using derivatives (swap/futures etc).

In figure 1 the forward curve is displayed in A$/mt. The forward curve shows the futures price for forward contract months.

The December 2020 contract which aligns with the Australian harvest is currently trading at A$316/mt. This is the highest level in five years, and provides a strong starting point for marketing grain.

As mentioned before the futures price is one component albeit one which makes up the majority of price (even in drought years – see here).

If using swaps/futures, the final price you receive will effectively be your futures price (A$316) plus basis at the point of physical sale.

In figure 2 the weekly average basis is displayed since 2010. As we can see the past year and a half is probably not a reliable indicator due to the drought led basis. However, the average across the country is:

  • Adelaide A$28
  • Geelong A$37
  • Kwinana A$49
  • Port Kembla A$51
  • Port Lincoln A$24

On the law of averages locking in futures and selling on average basis would return between A$340 & A$366. A price that is historically attractive.

*For the purpose of this analysis we are not including FX, and basing on a converted futures price.

Remember to listen to the  Commodity Conversation podcast by Mecardo

What does it mean/next week?:

The futures market is currently offering strong levels for December 2020. A large proportion of the rise in recent weeks has been due to geopolitical factors – which could lead to volatility.

At present these are high levels compared to the last five years. If you lock in a little at these levels, and it turns out to be the worst trade you do – it is still likely to be profitable.

Little and often wins the day.

It’s a deal, it’s a steal, it’s the sale of the century

A welcome sound not heard for a long time is being heard throughout large parts of NSW & QLD. The noise of raindrops hitting roofs. This week we cover a few factors from overseas impacting on markets including Egyptian purchases, Russian intervention, and the phase 1 deal.

In recent months weather forecasts have consistently tantalized without providing much (see map). Last week strong rainfall was forecast for large parts of the country, and like the boy who cried wolf – I didn’t believe the forecasts. As time flowed this one seemed to be coming to fruition, but I had been tricked into a false sense of security before.

To my delight, this one has delivered for many. Although this rainfall event would have been more welcome four weeks ago for the summer crop, it has provided a good dump of rain throughout the drought-ridden east coast. Let’s not get too cocky though, we’ll need a little more rain to guarantee a good 2020 crop.

Let’s start with the global market. At the end of last week, the Chicago futures market rallied as Egypt bought 300kmt of wheat, at the highest price since February. This volume was unsurprisingly black sea origin however provided a bullish sentiment for overall pricing.

Russia also assisted with the price rise by intervening in their markets. A new export quota limiting grain exports to 20mmt for the first half of the year was enacted. This caused some concern as interventions by what is now the world’s most important grain exporter could have ramifications for trade flows.

Relations between China and the US seemed to be thawing this week, as both countries agreed to a phase 1 trade deal. This deal is a starting point in improving trade between the two super powers, including the agreement to purchase an increased value in agricultural produce over the next two years.

In the agreement China are set to purchase $36.5bn (A$52bn) in 2020, and $43.5bn(A$63bn) in 2021. To put the scale of the increase in perspective during 2017 China purchased $24bn (A$35bn) in agricultural produce from the US (figure 2).

There is a lot of conjecture at present related to which commodities China will purchase in order to increase their value purchased.

The trade wasn’t overly impressed by the deal as it didn’t contain much detail in regards to products purchased, and included a market value clause:

‘The Parties acknowledge that purchases will be made at market prices based on commercial considerations and that market conditions, particularly in the case of agricultural goods, may dictate the timing of purchases within any given year.’

The big concern for me is that in order to meet these purchase requirements is that the trade flows may prioritise US as an origin for many agricultural commodities.

Remember to listen to the  Commodity Conversation podcast by Mecardo

What does it mean/next week?:

The rain is set to continue through many parts which will provide some confidence for the coming crop. This must be tempered by the reality of it being four months until seeding and nine months from harvest.

The price of GM crops

The South Australian government is debating a bill to end the moratorium on GM crop cultivation. I received information from a contact related to claims from anti-gm activists. I thought it was time to dispel some of the activist’s misunderstandings.

The Mecardo team produced a report on behalf of Grain Producers South Australia (GPSA) and the Agricultural Biotechnology Council of Australia (ABCA). This report was instrumental in removing some of the inaccuracies present in the debate when it comes to pricing.

The information we received was that farmers were avoiding GM crops in Western Australia due to the high premium (up to $100/mt). The reality is that in Western Australia >28% of the Canola crop has been GM in recent years, a considerable volume when you consider that GM is generally used as an agronomic tool for cleaning up paddocks.

In figure 1, the weekly average spread for GM to Non-GM in Kwinana is displayed. As we can see the claim of A$100 discount for GM is a bit of a reach. It has averaged close to A$100 at points during this year. However, it hasn’t stayed there for a particularly wrong period. The average discount for GM canola is A$31.

Co-existence is possible between GM and Non-GM. If it were not, we would be seeing very strong premiums in South Australia against Kwinana due to its GM-free status. However, we do not see this happening (figure 2).

The market never lies. If there was a substantive premium for canola produced in South Australia due to its GM-free status we would see it in the price.

What does it mean for next week?

It is important to understand that GM crops are part of a toolkit for farmers. The discount for GM canola is variable and market-driven.

It is true that there have been large discounts at times, however, it has been close to parity with Non-GM at numerous points over recent years. It is up to farmers to decide whether the agronomic benefits outweigh the discount.

It is important to note that many activists use the GM spread erroneously, depicting that introducing GM canola would result in all canola dropping in price. This is incorrect, it is important to compare apples for apples with Non-GM canola in states to determine if the GM-free status provides a premium for producers. It clearly doesn’t provide a premium.

Roll up, roll up for the wheat rollercoaster

Up, down, side to side. The rollercoaster of the grain market continues to provide excitement. As harvest advances pricing levels have risen. In this week’s update we take a look at ASX pricing, WA forecasts, Trump deals, and UK elections.


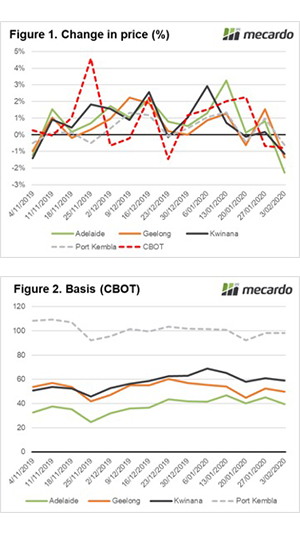
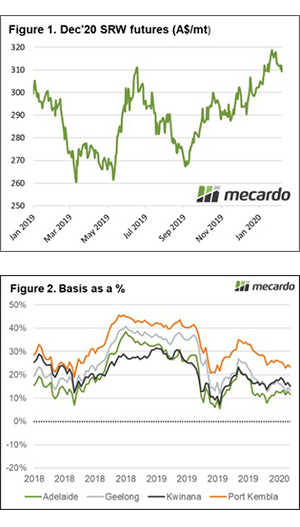
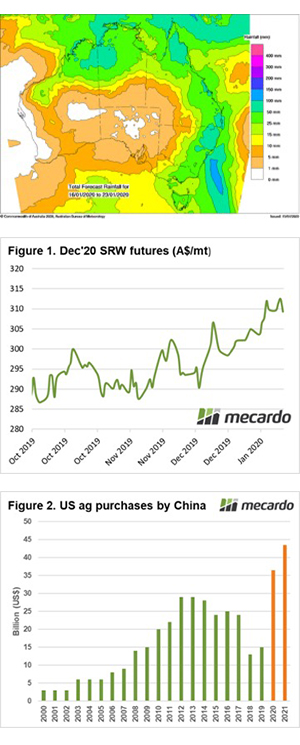
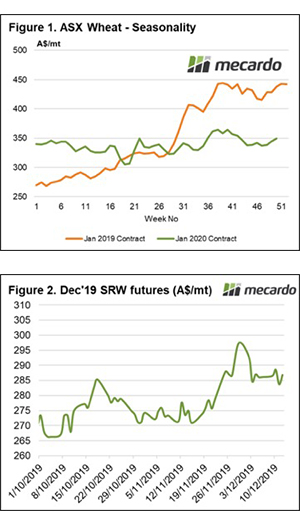
The ASX contract has risen dramatically during the past week, at the end of last week the December 2020 was trading at a weekly average of A$344 and has now moved up to A$349 (figure 1). There are concerns from feed consumers related to the slow pace of harvest in Victoria, which is driven both physical and futures levels higher.

The ASX swaps offered by banks are expiring during the next week, and we can clearly see that there are contracts being rolled from the January contract to May. This allows consumers to maintain cover for this season without having to convert to physical.

The Grain Industry Association of Western Australia released its updated crop forecasts. After a strong crop last year the crop has disappointed this season. The production estimates and month on month change are shown below:

  • Wheat 5.4mmt (-8%)
  • Barley 3.9mmt (+5.3%)
  • Canola 1.1mmt (+13.5%)
  • Oats 400kmt (-13.2%)

The GIWA results in the past have been generally quite accurate, however, after discussing with contacts in the west, these numbers have room for further downward revisions.

On an international level, we have seen US futures trading downward for most of this week, but we have seen a large rise overnight. This has been driven by comments from Trump related to positive trade talks with China.

It’s a bit like groundhog day now, where China and US get close to a resolution only for a last-minute pull back. At present, a limited agreement is on the cards which will prevent the new tariffs due to be implemented on Sunday.

This has driven the markets higher as the prospect of trade flows returning to normal. I believe that it will be a while until trade with China is back to normal and that these negotiations will likely continue for some time.

The UK went to the polls yesterday for the 3rd time in the past five years. The election has been one of the most contentious in recent years due to Brexit, with one side calling for further referendums and the other to get the deal done. The previous parliament was unable to reach agreements on the Brexit package after numerous votes, resulting in the current election.

As the voting booths close the exit polls are predicting a very strong conservative majority. If this eventuates, we will see a strong rally in the GBP.

Remember to listen to the  Commodity Conversation podcast by Mecardo

What does it mean? – Next week:

Feed demand remains strong at present with buyers looking to fulfill uncovered feeding requirements. This has provided a beneficial jump in values for producers. Whether this continues when grower selling increases is yet to be determined.

StockCo, me & my bank.

StockCo assists producers to really maximize the capacity utilization of their existing agricultural asset base, and this really drives growth opportunities. We do this by working very closely with the customer and their bank with the view of having some really mutual beneficial outcomes. StockCo does not compete with banks for business or their customers. Stock only provides livestock funding. We only fund sheep and cattle. So, we don’t do term lending. We don’t do equipment finance. We don’t provide transactional facilities. Our core business is simply livestock funding.

StockCo’s goal is to create value for our customers. We look to enhance the relationship they have with their current financier. This is ultimately providing them with a new pathway to increase livestock revenues. And ultimately this will help them deliver on an improved financial performance. StockCo’s facilities do not disrupt or interfere with an existing bank in terms of their security arrangements.