Tag: Analysis

100¢ lower in just over a fortnight

Just over two weeks ago the Eastern States Trade Lamb Indicator (ESTLI) was peaking at 951¢/kg cwt and yesterday it closed at 851¢ – how quickly sale yard sentiment can change as we approach the spring flush.

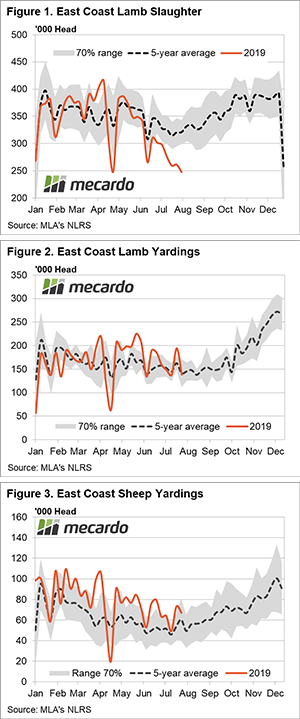
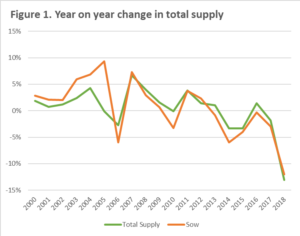
We aren’t in the depths of the spring flush yet, although Meat and Livestock Australia (MLA) reported this week of some early signs of new season lambs starting to show up in NSW. Meanwhile east coast lamb slaughter made a new seasonal low last week with under 248,000 head processed – Figure 1.

The reduced processor activity showing up at sale yard prices this week across the country with all national lamb and sheep indicators reported by MLA posting declines between 9-31¢ on a cwt basis. The National Trade Lamb Indicator (NTLI) easing by the greatest magnitude with a 3.6% drop to 842¢/kg.

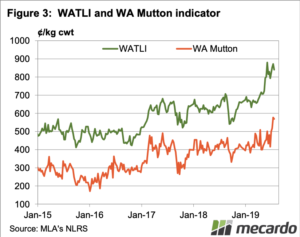
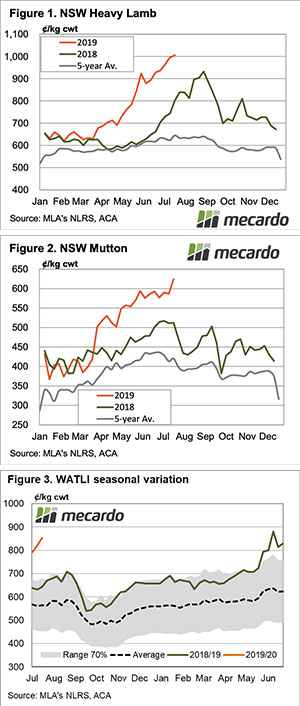
The National Mutton Indicator (NMI) not far behind, reporting a 3.3% fall to rest at 559¢. The NMI feeling the impact of softer mutton price in the West, with WA Mutton off 85¢ to close at 484¢. Mutton prices on the east coast managing to remain at reasonably good historic levels between 565¢-605¢

Restocker Lambs the least impacted, only 1.1% lower to finish at 801¢/kg cwt, boosted by strong gains to Victorian Restocker Lambs which were up 48¢ on the week.

Producers responding to easing lamb prices over the last fortnight by pulling back throughput with the east coast yarding levels easing 29% from the week prior to sit fractionally below the five-year seasonal average levels for this time in the year – Figure 2.

East coast producers seemingly happy with the current mutton prices nearer to the $6 region as mutton throughput continues to trek along the upper boundary of the normal seasonal range averaging over 63,000 head per week over the last month, which is 20% above the five-year trend -Figure 3.

Next week

The magnitude of the recent fall in the ESTLI seems a bit of an over-reaction given we are yet to see any significant numbers presenting at the sale yard. Some good rain again to the southern regions this week will also help stabilise the market so I would anticipate a consolidation of prices at current levels in the short term and the chance of a small rally before we head lower again.

Although, don’t expect to see the ESTLI back near 950¢ this season as I think we have seen peak a few weeks back.

Market opens weak and just gets worse

The wool market resumed after the winter recess selling in all three centres but it was an opening that many feared. Demand was negatively affected by the global uncertainty focused on the US/China trade dispute.

Most buyers would have called on their northern hemisphere customers over the break, and clearly the message they received was adverse for prices.

The Eastern Market Indicator (EMI) told the story, losing 31 cents on the opening day and a further 47 cents on Thursday, while the Western Market Indicator (WMI) gave up 134 cents across the two days of selling to close at 1,676 cents. With the significant drop in the AUD over the week, this put the EMI in US terms at 1,135 cents.

It was only the Cardings sector that posted positive results, with falls of 100 cents plus not uncommon across the MPG categories.

Added to the negative sentiment was the national pass-in rate, 25.8% on day 1 followed by 31.8% on Thursday. In fact, Fremantle auctions passed-in more than half of the wool growers offered for the week.

While this result was not entirely unexpected, it still provided a shock to the market. It also reinforced the maxim that reduced supply may lift prices in the short term if buyers are “squeezed”, but in the end, it is demand that will sustain a market.

The conclusion for now is that buyers are lacking the incentive to purchase, with stocks at mills mounting as global consumer confidence wanes.

41,543 bales were offered for sale across the three selling centres. However, with the pass in rate of 25.8% just 29,641 bales were sold. While the year on year offering for this week was up by 7,774 bales, the combined offering this season is 27,533 bales less than the first three weeks last season.

The dollar value for the week was $51.06 million, for a combined value so far this season of $164.22 billion.

The week ahead

While the correction of this week on the surface should attract demand, the magnitude of the falls could well induce buyers to wait it out to see where this market settles. It is a brave commentator who would call the bottom of the market, so we take a “wait & see” approach.

Will African Swine Fever impact upon grain prices?

The biggest issue in the protein markets at present is the African Swine Fever outbreak hitting hard in China. Clearly, there is a direct relationship between different meat products – but what about grains?

At Mecardo we examine a wide range of markets to provide insights into possible disruptions within the marketplace. This allows the team to cover a wide range of markets and commodities, and not solely examine one restrictive area. In the coming weeks, the Mecardo team will be working on various analysis related to the potential impact of this black swan event.

African Swine Fever is one of the worst ailments to hit pigs, and it is currently flowing its way throughout China. There are a wide range of estimates of the potential damage, ranging from very low government estimates (1m head) through to industry estimates of >200m.

In figure 1 the year on year change (as %) is shown for total supply of pigs and sows. As we can see This season is expected to experience an extremely sharp decline in numbers (13%), which is the highest decline since 1996. There is potential of further downward revisions if the worst projections are realized.

Why or how could this impact upon grain markets? In China, like most countries around the world pigs are fed on a grain-rich diet in sheds. If the worst projections are realized then feed demand for a large proportion of the worlds protein will be taken off the balance sheet.

The main ingredients in Chinese pig feed are Soybean meal and corn. In order to meet the demand for feed, imports have increased in recent years. The biggest import program is soybeans, which are then crushed to produce meal and oil.

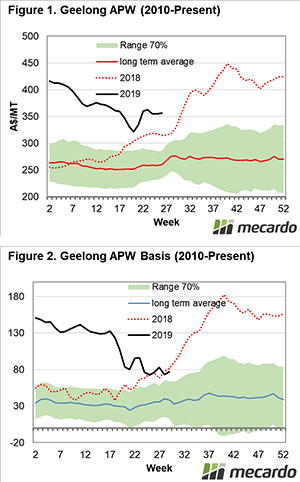
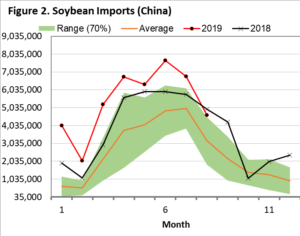
In figure 2, the seasonality of soybean imports into China are shown from 2012 to present. Interestingly when I ran these numbers, I was expecting soybean imports to trending downwards. At present this is not the case with soybean imports appearing to be well above the range expected.

If as expected demand does finally drop, then we would expect that soybean prices will decline, which feasibly could have a flow-on effect onto other oilseeds (palm/canola).

Remember to listen to our podcast


What does it mean/next week?:
At the moment the estimates of the losses are all ‘Chinese whispers’. I expect that over time import volumes will be a strong indicator of the losses felt throughout the Chinese pork supply chain.

On Thursday I will be looking at other indicators including corn and local grain prices in China.

Southern restockers starting to nibble at EYCI

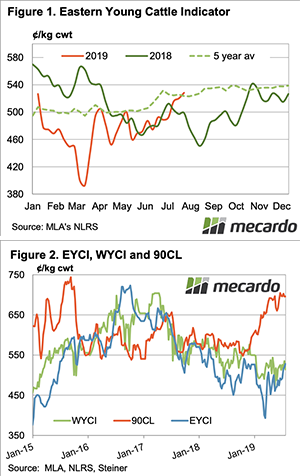
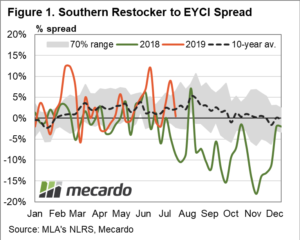
A recent discussion with some livestock industry representatives this week suggested that in the southern regions, at least, restocker buyers were becoming more active. Certainly, the Eastern Young Cattle Indicator (EYCI) continues its grind higher closing at 532.5¢/kg cwt yesterday, up 1¢ on the week. But is it being supported across the eastern seaboard or by southern restockers?

Analysis of the spread southern restockers are paying for EYCI eligible cattle up until the close of trading last Friday showed that southern restockers had been paying better than average premium spreads to the EYCI for the first few weeks of July, but it had narrowed to sit underneath the seasonal average trend in recent times – Figure 1.

Indeed, as of last Friday the southern restocker spread to the EYCI sat at a premium of 0.5% prem compared to the five-year seasonal average for this time of the year at a premium of 2%. Not indicative of southern restockers becoming too enthusiastic about the market, but decidedly better than the 8.8% discount spread that they were paying at this time last season.

In contrast, Northern restockers are yet to really get involved this season with the spread to the EYCI as of last Fridays closing prices sitting at a 4.8% discount compared to a 0.2% premium spread as per the five-year average spread pattern, Figure 2. At least, as a consolation the northern restocker spread has moved above the trend set during the 2018 season, which was running at a 6.8% discount to the EYCI this time last year.

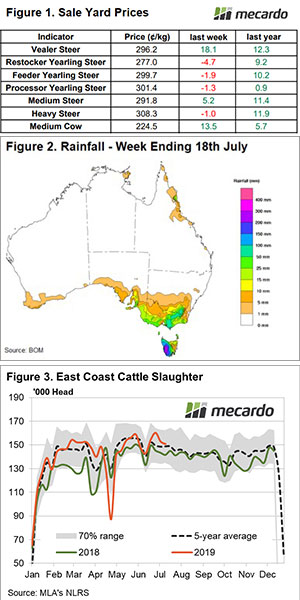
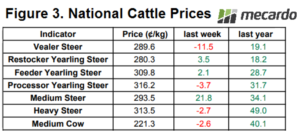
National cattle prices at the sale yard reflecting the tepid restocker interest of late with Restocker Yearling Steer prices lifting 3.5¢ on the week to close at 280.3¢/kg lwt. Medium steer the big winner on the week across the national price averages posting a 21.8¢ gain to finish at 293.5¢/kg lwt – Figure 3.

Next week

Another week of limited rainfall is on the horizon. Coastal south western WA and southern Victorian regions are slated for 10-25 mm but not anything for where it’s really needed. This is going to continue to constrain restockers further north and put a cap on any price gains beyond what the tight winter supply scenario can offer.

Correction or the downturn?

Lamb markets tanked this week. They were coming off close to record highs, but the price falls tell us that something has shifted in the supply/demand equation. So which is it?

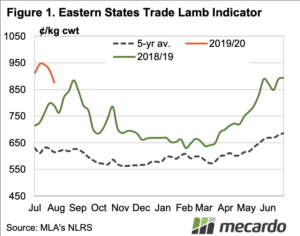
The Eastern States Trade Lamb Indicator fell heavily this week. It’s still at a good level, at 876¢/kg cwt (Figure 1), but it’s now below 900¢ in all states. Last year the ESTLI made a similar heavy decline from its peak, but it was later.

The yarding figures run a week late, but they had a significant lift last week. Lamb yardings moved back within a whisker of 200,000 head on the east coast last week (Figure 2), and it would seem they were strong again this week.

Lamb slaughter wasn’t any higher last week, it might be up a little this week, but the fall was likely down to processor maintenance closures. Seasonal maintenance, combined with increasing numbers at saleyards will usually see prices fall.

The question now is whether prices can make a comeback, or if we have seen the peak. We have seen lamb prices find a base and kick again in the past, but not since 2007.

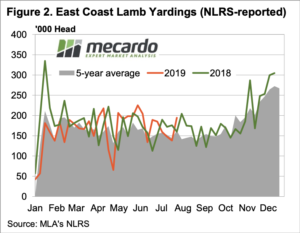
Mutton values also lost ground, but not to the same extent as lamb. In WA, mutton managed to hold on to record highs (Figure 3), and is now very close to east coast values. WA Lamb prices are also in the high 800¢ level, so perhaps the east coast is coming back to export parity.

Next week

If lamb producers don’t like the price fall and pull back supply, prices are likely to steady.  Prices are still historically strong though, so lambs might keep coming.  No matter what the market does from here, the $10 forwards are now looking like very good selling.

Seasonality in your area #1 – Geelong

You should have started your grain marketing program by now, but if you haven’t it’s time to start keeping an eye on the market. In this series of articles, we will examine the seasonality in pricing for wheat across the country. This week we will start off in Geelong.

Seasonality can provide an indication of the performance of a commodity, in a similar way to deciles. We regularly use them to show how the market is travelling at present compared to previous points in time and view patterns that might emerge.

In these seasonality charts, rather than use a min/max for the seasonality banding (green shaded area), we use a 70% range (or 1 standard deviation). The 70% banding is used to remove the extremes in the marketplace, which we believe gives a better indication of the seasonality, as opposed to a min/max which can be extremely volatile. In these charts, we also overlay the average for the timeframe and the recent seasons.

In figure 1, the flat price for APW wheat in Geelong is displayed. The flat price is the price that you will receive from a buyer (the combined futures, basis and FX). During the past year we have experienced extremely high prices. Even now with prices falling close to A$100 since the peak, they still represent strong levels.

In figure 2, the basis level between Chicago and Geelong is displayed. In order to get the best return for your production it is important to understand basis (explanation here). The extreme basis was the reason behind the high prices during the past season. The drought has caused premiums above Chicago to increase due to the scarcity of supply locally.

In both flat price and basis we can see that for the first six months or so they trade in a relatively narrow band. The last half of the year is where any action will arrive, this is where the price will either rise or fall dependent upon how the season progresses – more grain lower basis (and vice versa).

Key Points

  • The Geelong market has fallen close to A$100 from this seasons’ peak, however remains at prices which would be historically attractive.
  • The first half of the year tends to trade in a narrow range, followed by a bigger spread in the second half of the year.
  • Prices are liable to be volatile as we move close to harvest so we may see some downside.

What does it mean/next week?:

The spot price has declined markedly but due to the rainfall and moisture profile this year, this signals good prospects for the upcoming harvest in regards to production. We are now at the midpoint where the pricing will reflect the supply of Australian wheat. However, until harvest, spot prices are likely to be extremely volatile as pantries remain empty.

Some normal seasonality returning

There has been more rain in the far south and nothing to speak of in the north, yet the Eastern Young Cattle Indicator (EYCI) continues to climb.  This week we saw the EYCI hit a new 2019 high, and tip just past the five-year average.

The south is definitely helping to push the market, with Wagga the most expensive in the EYCI this week at 615.75¢/kg cwt. Although Dubbo did bolster the numbers, with 12% of the market, at 582¢.  As with most weeks, the Roma store was the biggest market, making up 18.6% of the EYCI, but we couldn’t find the price.

It has been over seven months since the EYCI was above 525¢, with early November being the last time. Despite the continued dry, the EYCI seems to be following more of a ‘normal’ seasonal trend.  This involves rising in winter as supply tightens and demand improves.

The improvement in demand is coming from southern growers, who are becoming more confident of spring growth and some replenishing of fodder supplies. We have been harping on lately about the high slaughter rates in Victoria, so perhaps some demand is coming from those looking to restock.

Over in the west, the Western Young Cattle Indicator (WYCI) slid lower this week.  At 514¢, the WYCI is now below the EYCI for the first time in 18 months (Figure 2). Both the EYCI and WYCI have plenty of upside potential, with the 90CL remaining steady at close to 700¢.

Next week?:

Southern areas of WA, SA and Victoria are forecast to receive more showers next week and this should keep demand in those areas strong. The lack of rain in NSW and Queensland will keep a lid on any price rises. 

Record breaking heat in Europe

In this week’s comment we take a look at local pricing and the current environment in Europe. Will the weather help or hinder the crop?

The futures market has largely been bereft of data to drive it during the past week and has largely traded in a narrow band. December Chicago futures are down A$3 since last Friday and A$28 from recent peaks.

On a global level the International Grain Council have revised their forecasts for the coming season. Global production is down month on month by 6mmt, with consumption also being revised downward by 3mmt. Overall stocks were brought down to 270mmt, which remains joint record with 2017/18.

At a local level, old crop pricing has come under some pressure (figure 1). As we move closer to harvest, I can foresee two potential scenarios:

  1. The price declines will continue until the new crop harvest or until they converge with new crop pricing.
  2. If there are any delays to harvest, old crop will rally as hand to mouth consumers chase what little is left.

Europe has experienced some extremely hot weather with records being broken across the continent. The wheat/barley crop is unlikely to be massively impacted as they are harvesting, however corn remains the biggest risk. The hot weather could ultimately lead to downgrades to yield. In a similar fashion to the US corn/wheat story there could be a flow on effect on wheat pricing.

Remember to listen to our podcast 

What does it mean/next week:

Analysts are currently looking at the Russian wheat crop, with the consensus being that a good crop will be produced but not a record worthy one. Interestingly it is looking like Ukraine are on track to produce a record crop.

Sideways – not just a movie about sad old men

The Eastern Young Cattle Indicator (EYCI) managed to eke out a limited gain this week, lifting 4.45¢ to close at 520¢/kg cwt. Limited rainfall across much of the nation, except Victoria, acted as a headwind. Meanwhile, tightening supply across the east coast stopped the market from tanking too much.

National sale yard cattle indicators for the week were somewhat mixed, albeit within a narrow range with the opposing forces of limited rain and reduced supply keeping markets in a broad sideways pattern.

Yearling and Heavy Steers were marginally softer, coming in 1¢-5¢ lower across the nation. Vealer and Medium Steers, along with Medium Cow managed a little better with gains between 5¢-18¢ noted – Figure 1*. The National Vealer Steer indicator was given a significant boost this week by a large jump in WA Vealer Steer prices, up nearly 92¢ to close at 309.2¢/kg lwt.

It probably comes as no surprise given the rainfall pattern this week (Figure 2) but cattle prices in Victorian sale yards showed the most vigour across the states with gains between 8¢-23¢ noted for all reported categories, except Victorian Vealer Steers.

Looking at the east coast slaughter trend in recent week we have seen levels begin to trend lower since the start of July – Figure 3. A few weeks back we were processing around 160,000 head a week across the east coast, currently we are running at around 150,000 head and its likely in a few weeks’ time numbers will ease toward the 140,000 head region. That’s if the market follows along roughly with the average seasonal trend (black dotted line on Figure 3).

* All cattle prices in Figure 1 are expressed in ¢/kg lwt terms

Next week

The rainfall forecast for the coming week shows a repeat of this week, with falls limited to Victoria, coastal SA and the south west tip of WA. Limited rainfall on the horizon and the prospect of a dry finish to winter and a dry start to spring won’t do a lot to get cattle prices moving aggressively higher.

Seems like it’s a continuation of the sideways moves for the near term. If you are getting bored watching the sideways moves of the cattle market check out the 2004 comedy/drama Sideways over the weekend – its worth a laugh or two.

We’ve got an indicator at $10

Lamb supply continues to contract and with it, prices are on the rise, mostly.  There were a couple of negative spots, especially in the restocker department, but we did see an indicator break through the extraordinary 1000¢ level.

New South Wales was where the action was at. The NSW Heavy Lamb Indicator was the first to break through the $10 mark.  NSW Heavy Lambs gained 28¢ this week to hit 1005¢/kg cwt (Figure 1).  Last year the peak in prices saw NSW Heavy Lambs leading the charge as well, no doubt dry times makes them hard to produce and in short supply.

It is especially hard to carry heavy lambs through when prices have been at record levels for more than a month.

Mutton also broke through resistance this week.  NSW (Figure 2) and Victorian Mutton Indicators both moved through 600¢, posting 624 and 620¢/kg cwt respectively. This time last year Mutton prices were falling, but the lack of stock left and the better season are now driving prices to new highs.

There were losers this week despite the records.  Restocker lambs eased back to the 800-820¢ range. Old season lamb demand is waning as the risk of cutting teeth increases, while no one seems to be selling restocker suckers in the saleyards.

On Auctionsplus restocker suckers are making more than $10. There was one lot of first cross ewe lambs which made $20/kg cwt. They were very light, but $150/hd for a 20kg lwt lamb is extraordinary.

Things are good in the West, but not as good as the east. The WATLI gained 31¢ to 853¢/kg cwt (Figure 3) and is not far off the record high set in June. WA Mutton did hit a record however, rising 34¢ to 518¢/kg cwt.

Next week?:

The coming month will be intriguing for lamb and sheep markets. A lot will depend on how quickly new season lamb producers can get weight into lambs and get them to market. There can’t be many old season lambs left.