Tag: Articles

Feeders pressuring restockers supporting

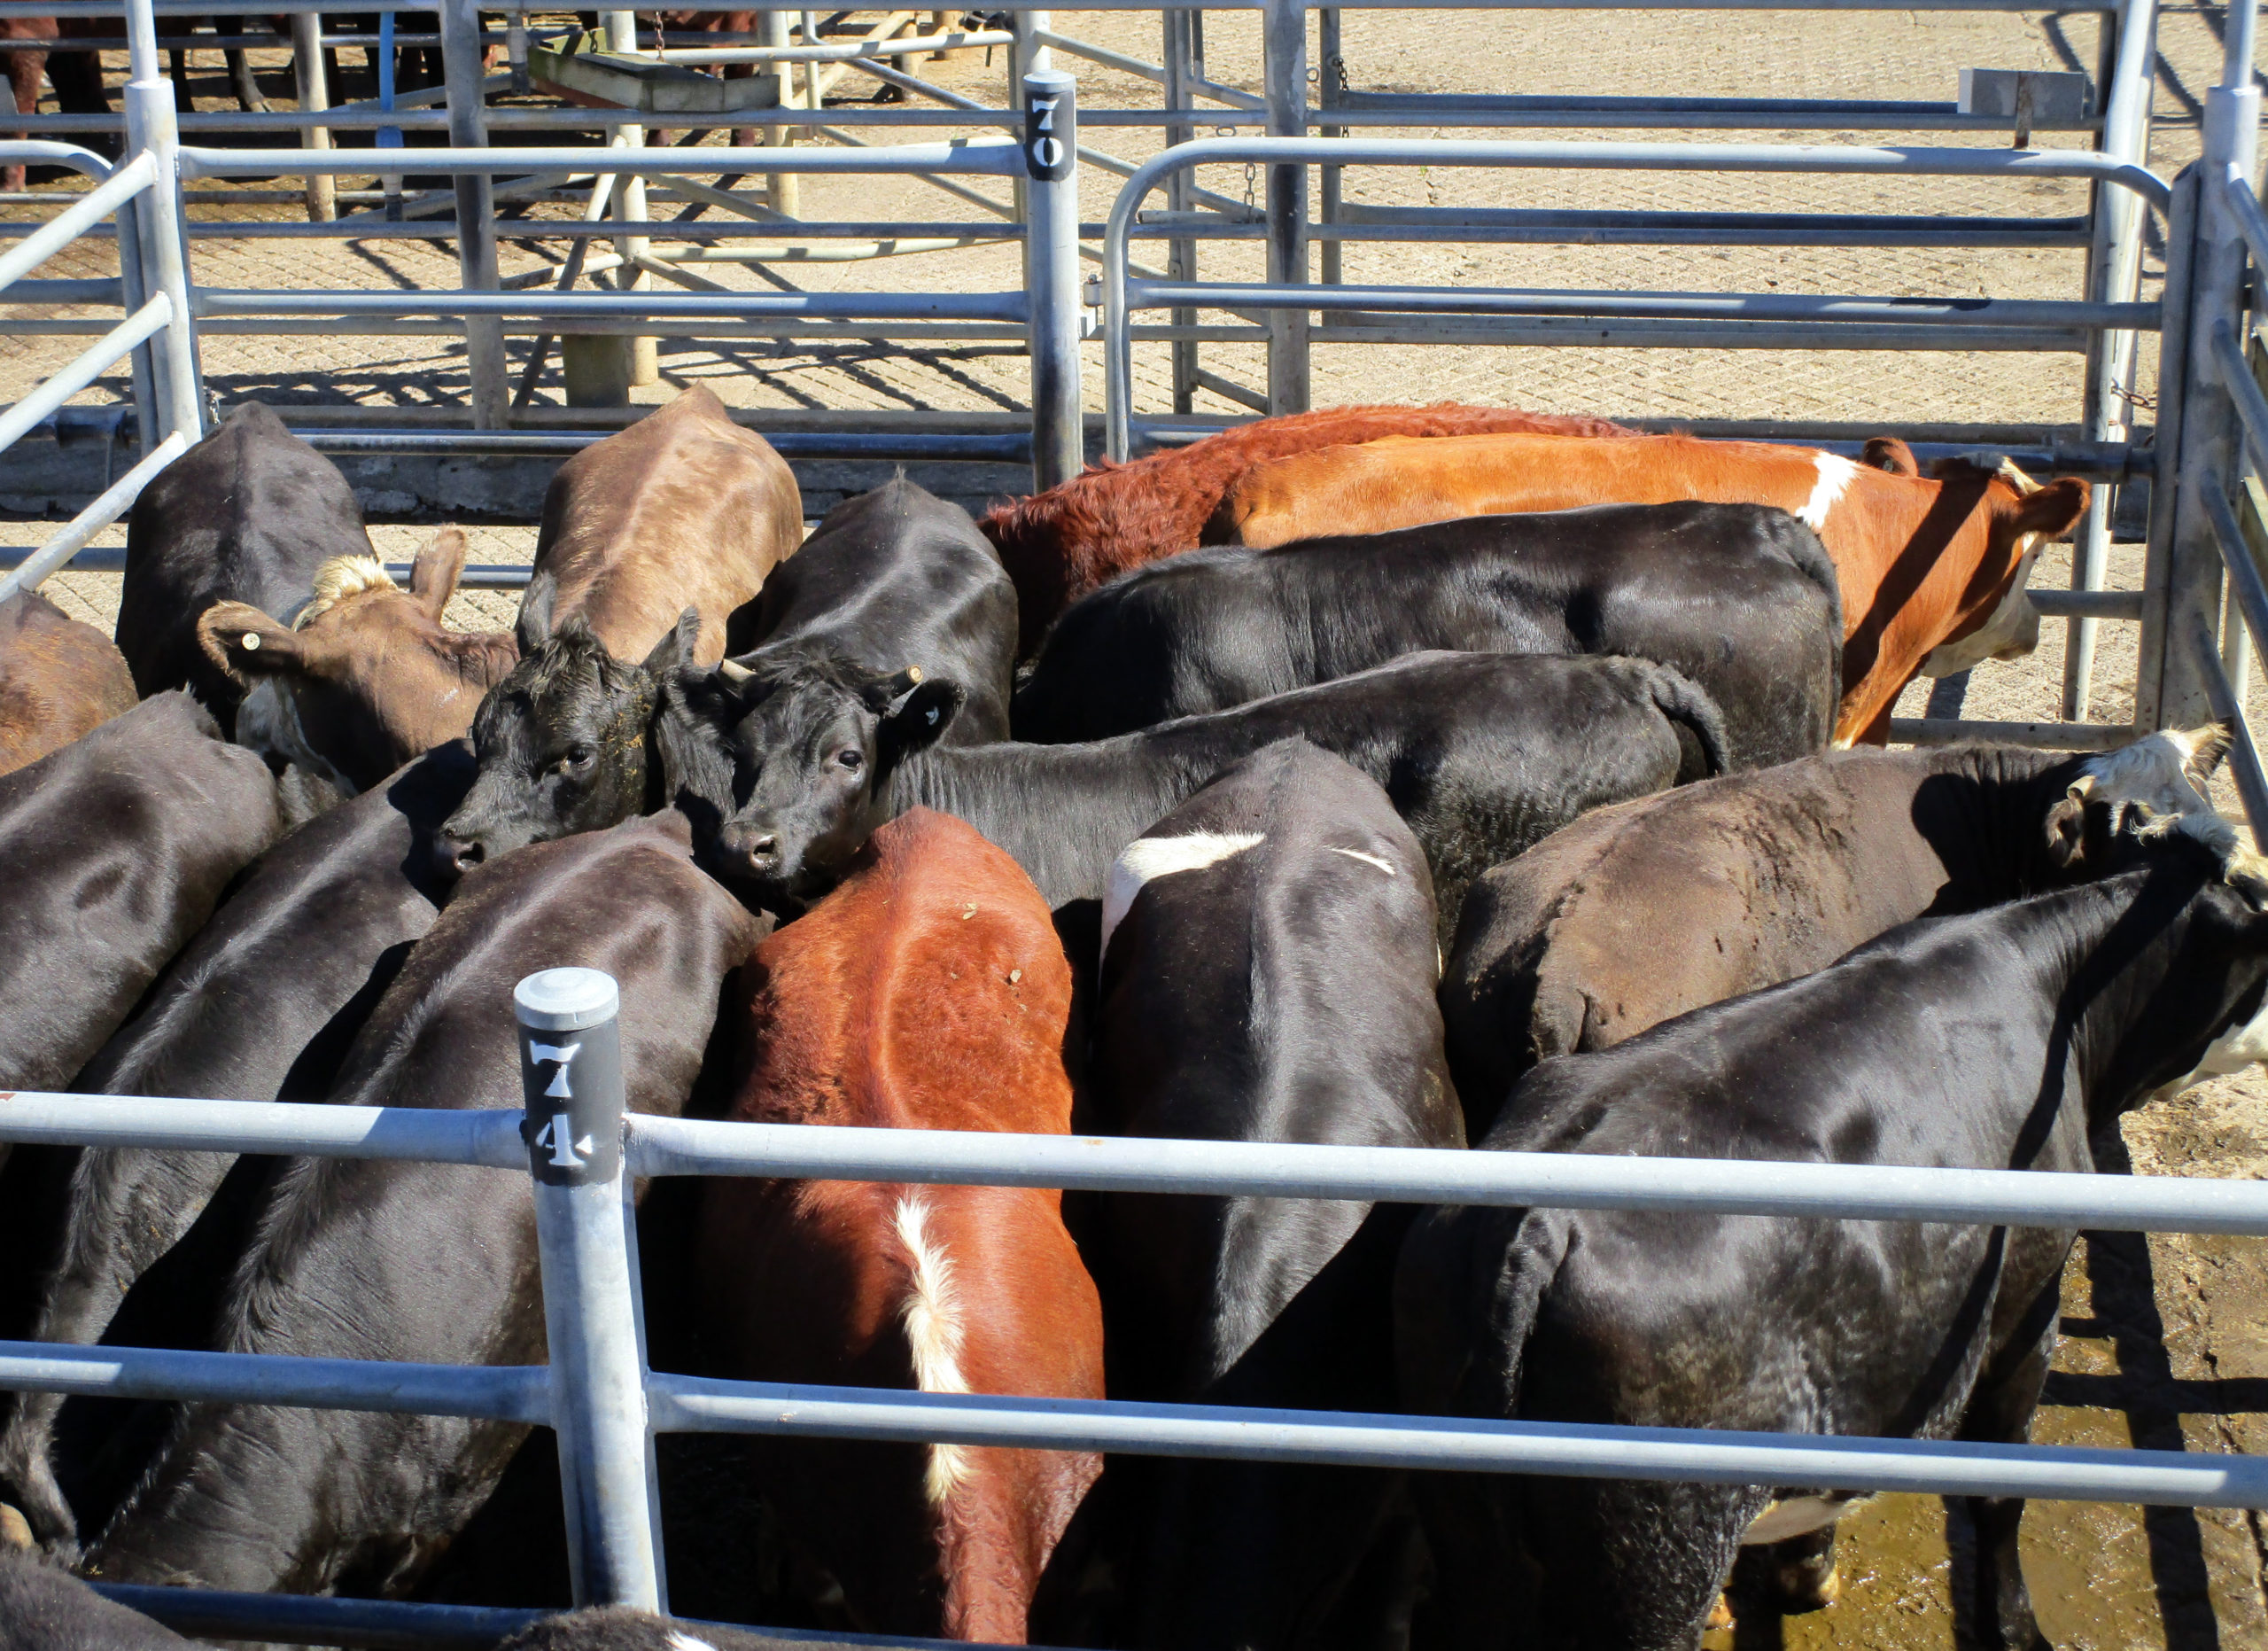
Livestock producers are not flying blind, with price information still available, but it is a bit harder to get a snapshot of the market.  With cattle sold at ¢/kg rates in many markets, there are still averages available, which Meat and Livestock Australia (MLA) are calling the CV19 Indicators.

Cattle markets in general appeared to find some support this week.  With export values bouncing higher, and some good rain forecast for New South Wales and Victoria growers might have found some confidence to hold onto cattle.

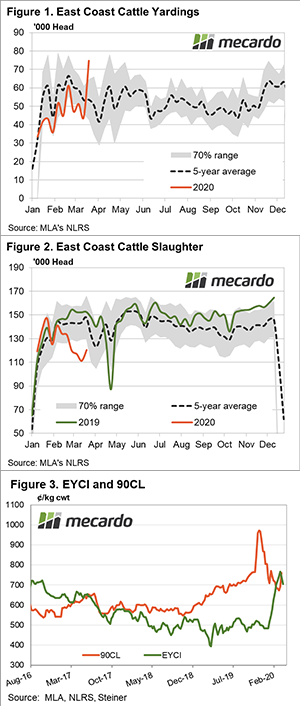
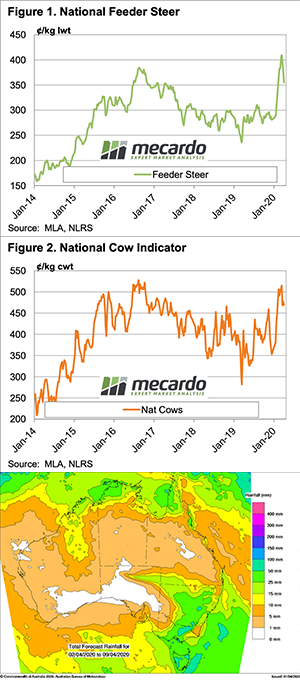
Feeder cattle prices continued to slide this week, but as reported in last week’s analysis, this was driven by squeezing lotfeeder margins.  Still, looking at figure 1, cattle producers could be forgiven for continuing to sell.  At 350¢/kg lwt there have only been some rare occasions when feeder prices have been higher. The problem is the record was set just a month ago, and is still pretty fresh.

Restocker cattle prices remain strong, despite rising grain values.  A quick scroll through Auctionsplus showed light 200-250kg steers still making over 400¢/kg lwt.  We are back to more normal spreads, with ¢/kg rates fall as cattle get heavier, but there were plenty of sales between 350 and 400¢.

Cow values eased marginally this week, but have only given up 8.5% from the peak. Figure 2 shows that Cow prices are still better than most other times in the past 3 years.  Autumn normally sees cow supply improve, but it should be tighter this year than last.

Next week.

The rain forecast for the coming week should see cattle prices find support, but pressure will continue to come from tight processor and lotfeeder margins.  Grass finishers will continue to drive young cattle prices, with margins still good if feed is cheap.

There was some positive news on the export market front, but its manufacturing beef which usually does well in an economic downturn.  It is the higher value end of the market which is of concern.

Disease keeping wheat prices strong.

Key Points

The market has been assisted in recent weeks by the high levels of uncertainty. This week the wheat price has fallen, albeit remains strong.

Let’s start this weeks’ commentary on a global level. The price of a December CBOT wheat contract has fallen dramatically in the past week. On the 25th March the contract was trading at A$352, it has now fallen to A$334. A fall of A$18 is considerable, however it has to be noted that it had risen A$51 during the preceding ten trading days (figure 1).

In Australian dollar terms the futures have lost some ground as our dollar increased from 55¢ to 60-62¢. A higher dollar reduces the price on an Australian denominated swap.

Fundamentally the wheat market is relatively bearish, however, the uncertainty caused by COVID-19 and the associated government interventions can add a huge amount of volatility. Here are a few reasons for movements lower in wheat:

  • There are deepening concerns related to the global economy. As unemployment rates around the developed world skyrocket there will be a slowdown.
  • Eqypt, traditionally the worlds’ largest wheat importer started a tender process then suddenly pulled the tender.
  • There has been speculation that Russia will introduce an export ban. At present this is proposed as a 7mmt export limit between April and June. In reality no more than 7mmt would likely be exported in this time frame.
  • Corn prices continue to edge lower as ethanol drops to record low levels in the US.
  • The FAO expect near record wheat production in 2020.

In reality, the market has bearish tones, and if it were not for COVID-19 the pricing levels would likely be substantially lower than they are at present.

Market plummets

The stable market reported last week vanished quickly in sales this week as buyer confidence evaporated. Border closures in India & Italy, along with difficulties obtaining finance during this difficult time caused buyers to dramatically reduce buying limits. By weeks’ end, the EMI recorded its largest fall in percentage terms since May 2003.

Last week buyers reacted to concerns about supply and the risk that sales would be closed, this now appears a premature move. This week it was the concerns about consumer confidence and the lack of orders from retailers for next northern hemisphere winter coming forward.

The Eastern Market Indicator (EMI) lost 97 cents on the first day of selling, with a further 58 cents on the final day to close at 1,287 cents, a loss for the week of 155 cents. The Australian dollar contributed to the carnage, rising 2.09 US cents to be quoted on Thursday at US$0.613. This cushioned buyers to some degree, with the EMI in US terms down 65 cents to 789 cents.

The Western Market Indicator followed suit, retreating 159 cents to close at 1,353 cents.

Of the original roster, 16.6% was withdrawn prior to sale by growers, this produced a reduced offering compared to last week of 37,713 bales. The pass-in rate surged to 44.9% nationally leaving just 20,780 bales cleared to the trade. This was 16,000 fewer than last week.

Sales are running 200,000 bales behind the same period last season, or just shy of 6,000 bales per week fewer.

This week the total sales value was $28.33 million (down $27 Million on last week) or $1,363 per bale also down $140 per bale compared to last week.

Crossbred types were not spared, losing 100 cents plus across all indicators, despite growers passing-in more than 50% after significant volume was withdrawn pre-sale.

The strong crossbred types were friendless, with the 32 MPG slumping 109 cents to 300 cents, the lowest level since 2008. Cardings lost 88, 152 & 74 cents in Sydney, Melbourne and Fremantle respectively.

The week ahead

Sellers remain keen to get wool to sale with 44,216 bales listed for next week and all centres again selling on Tuesday & Wednesday only.

What happens next week in the market is anyone’s guess, confidence is shot from the buyer perspective, however, it is assured that the 44,000 bales currently rostered won’t all be sold.

Down cycle extended by pandemic

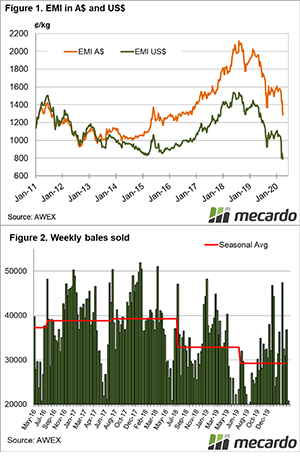
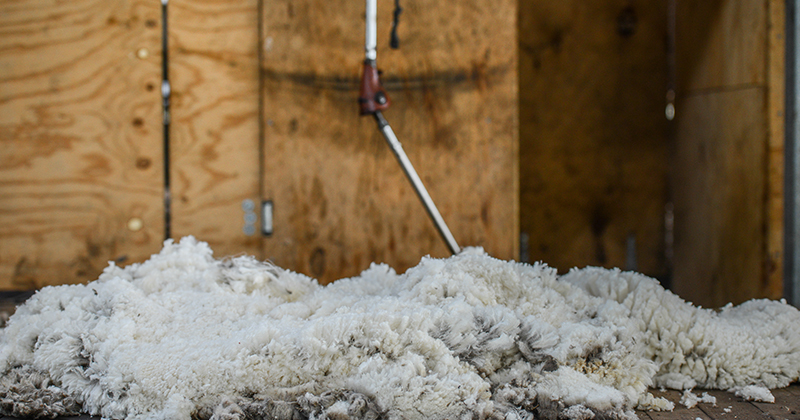
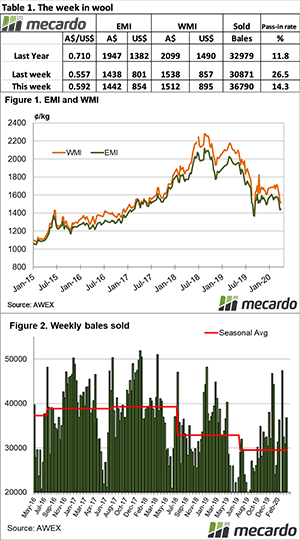
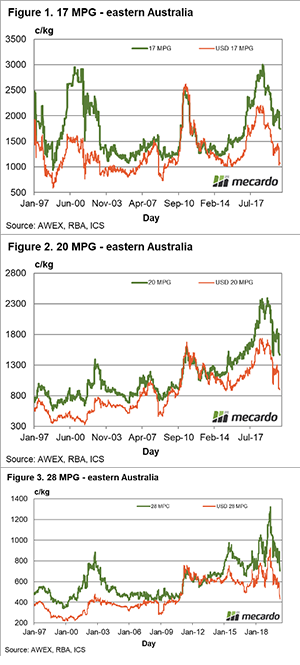
After trending lower for 18 months, wool prices would normally start to look for reasons to stabilise. That appeared to be the case in late 2019, but the occurrence of a pandemic (COVID-19) has added a further leg to the existing cyclical downturn in wool prices. This article takes a look at the latest step down in price.

It is helpful, if somewhat occasionally confusing, to look at wool prices in both Australian and USD dollar terms. Usually, they tell the same story in terms of trends and cycles. In the current market the views vary in terms of value, with the US dollar value (percentile if you like) a lot lower than we see in Australian dollar terms.

With the price falls this week in place, wool prices in US dollar terms are plumbing five year lows. 2015 was the last major down cycle. Figure 1 shows the 17 MPG in Australian and US dollar terms from early 1997 to this week. The US dollar value is very close to its five year lows while the Australian dollar value for the 17 MPG is close to its 35th percentile for the past five years – still higher than for 35% of the past five years. For the 17 MPG we watch to see if new business comes into the market to hold it at or above US1000 cents. If not the next set of lows, reached in 20008 and the early part of the 2000s, around US 850 cents becomes the target.

Figure 2 repeats the exercise for the eastern 20 MPG. Note how the 20 MPG price in both currencies is remains well above the general price levels prior to 2011. In US dollar terms the 20 MPG is back to 2015 low levels. As with the 17 MPG, if support for the 20 MPG does not appear around US900 cents then the lows reached before 2011 become the next target.

Finally Figure 3 shows a similar analysis for the 28 MPG. In US dollar terms the 28 MPG looks particularly weak, as it has fallen below levels traded at during the past decade, and looks to be headed back down to levels last traded at in mid-2010. That implies further prices falls in the order o 8-10% to get the 28 MPG down to around US400 cents, before support turns up.

The unprecedented (at least in peace time) issue in this market is the lockdown of the supply chain at the retail level which is shrinking (quickly) the demand for greasy wool. We have the situation of a greasy wool market delivering wool for which demand has been slashed for an unknown period of time.

Key points:

  • In US dollar terms the market now looks for support for merino prices in US dollar terms around current levels which line up with 2015 lows.
  • The 28 MPG looks to have further downside to go, before finding support in US dollar terms.
  • The price falls since January can be seen as an extension of the pre-existing down cycle, stimulated by the pandemic.
  • It will take time for the next rising price cycle to develop, it will not be a quick process.

What does this mean?

The supply chain needs some wool but not the supply coming onto the market at present. It is unknown for how long this situation will persist. In the interim some parts of the supply chain will require wool so supply needs to be maintained but at lower volumes. While normal volumes are offered for sale, prices will continue to be under downward pressure.

Rush to offload eases amid supply chain uncertainty

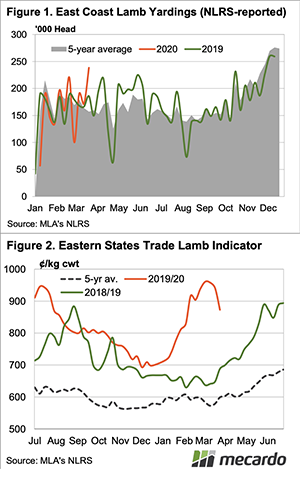
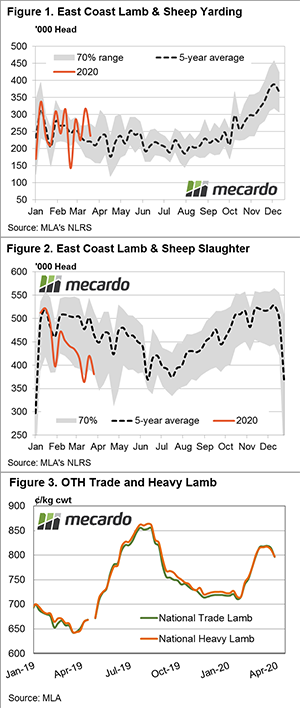
In an environment of limited price data and scant access to sheep/lamb indicators we are used to there is still the ability to see what is going on with throughput volume and slaughter. Producers respond to lower prices with a reduced offering at sale yards and meat works reluctant to increase their appetite as supply chains slow and export markets pause for Covid19.

East coast lamb and sheep yarding levels have eased in recent weeks as the rush to offload stock amidst the Covid19 uncertainty abates and prices continue to drift lower. Weekly lamb yarding dropped nearly 30%, while mutton yarding dipped 15% to see combined throughput finish just under 240,000 head.

Compared to the week prior the lamb and sheep is off 25% to rest 7% above the five-year trend for this time in the season – Figure 1. The Easter break often sees ovine throughput reach a seasonal trough during April so the downward trajectory in sale yard volumes is to be expected.

After a short blip up in east coast lamb and sheep slaughter volumes during mid-March weekly levels returned back to the lower end of the seasonal range with the combined lamb/sheep slaughter figures dropping 9% to finish near 380,000 head – Figure 2.

Lamb exporters have been finding it difficult to find cargo space on passenger flights heading overseas as airline traffic grounds to a halt and the supply chain backlog suggests processors are hesitant to increase slaughter activity.

MLA reported just over 20% of chilled lamb exports made its way overseas as air freight in 2019 (measured on a value basis) so it is not an insignificant amount that needs to be transported. Hopefully, the federal government’s announcement of a $170 million rescue package for delivery of export produce to our key export markets will provide the capacity to get sheep meat exports moving again.

What does it mean/next week?:

The continued uncertainty over export demand and supply chain issues saw OTH indicators replicate the sale yards this week as OTH trade lamb prices softened 3% to close at 788¢/kg cwt. OTH Heavy lamb followed the weakening trend too, shedding 2% to rest at 797¢/kg cwt – Figure 3.

It is hard to see lamb and sheep prices bucking the trend for a downward bias in the week leading up to the Easter break, particularly while the spectre of Covid19 looms over offshore sheepmeat demand and continues to play havoc with the export supply chain.

Kansas/Chicago – A spread trade strategy.

Key Points

Kansas typically trades at a premium to Chicago. However, since 2018 Chicago has been running at a strong premium. In September we put forward a strategy for a spread trade to benefit from a mean reversal in values.

The two wheat contracts in the US are the Chicago soft red winter (SRW) wheat contract and the Kansas hard red winter (HRW) wheat contract. These are two distinct contracts with differing specifications, the SRW is low protein (9.5%) whereas the HRW is mid protein (11%).

Typically, Kansas would trade at a premium to Chicago wheat. However, the spread has changed to a strong Chicago premium over Kansas during 2018. During September the spreads reached highs of 28% over Kansas, and an average for the month of 22%. The market has since fallen to 15% (figure 1).

Those who followed this spread trade strategy have a return of 13%, not a bad return on investment in the current climate. However, the spread remains at 15% – still well above the long term average of -3%.

As China starts to ramp up purchases as part of their Phase 1 obligations and extra demand for milling wheat due to panic buying – there is still an opportunity for this spread to return to normal levels.

So as a refresher, here are some strategies on how to do this:

What simple trades can we do?

Long Kansas: It is possible to take out a straight futures contract for Kansas. In this scenario, we would purchase the Kansas futures contract for a forward period. In this scenario, we would be buying with the expectation of Kansas futures rising to meet Chicago.

There is however a risk that the Chicago contract could fall to meet Kansas, or worse that Kansas falls further.

Spread trade: If we only want exposure to the spread between the two contracts, we can trade both Chicago and Kanas.

Whilst buying Kansas, we would take an opposing contract by selling Chicago. If this trade was executed, there would be no interest in the underlying price, only the spread between the two contracts.

Here are few hypothetical scenarios of the end results (table 1):

  1. The spread increases: The trade will result in a loss.
  2. The spread returns to normal levels: The trade will result in a profit.
  3. The Spread remains the same: The trade will be neutral.


Remember to listen to the  Commodity Conversation podcast by Mecardo

What does it mean/next week?:

This provides an opportunity to participate in further potential falls in the spread between Kansas and Chicago.

As with all strategies, there are risks involved. It is worthwhile getting advice from your risk management consultant.


December like yardings pressure markets

Lamb supply ramped up last week, and without supply data for this week, it looks like it might have been just as strong. Panic selling hit the market and sent prices back towards early February levels. The good news is that prices remain historically strong.

Lamb yardings for the week ending the 20th March hit levels usually only seen in December (Figure 1). This week the strong supply continued, and while we don’t have total numbers, looking through the major sale yards it looks like they may have been over 200,000 head again.

Lamb slaughter was also up last week at around 350,000 head. The extra numbers in the yards, combined with similar panic in bookings direct to works saw prices continue their decline this week.

The Eastern States Trade Lamb Indicator (ESTLI) duly tanked this week, as supply overwhelmed demand.  On Wednesday the ESTLI sat at 873¢/kg cwt (Figure 2). By no means disastrous, but down 10% on the highs. Wagga was also lower on Thursday, so the ESTLI is conceivably lower again, but we’ll never know.  More on this later.

South Australian lambs were cheaper than WA trade lambs this week, at 775¢ and 797¢/kg cwt respectively. Mutton is still cheap in WA at 513¢, while Victoria had the most expensive mutton at 705¢/kg cwt.

All prices received this week were still well above the same time last year, which is part of the reason the panic selling has taken hold. With lamb and sheep prices still in the top echelons of historical values, sellers will sell in fear of prices heading further south.

Next week.

There were some forward contracts about this week for April and May in the mid-800¢ range for lambs. This suggests processors are still worried about supply and are keen to lock in a portion of what is left.

Meat and Livestock Australia are changing the way they report prices, with officers no longer attending markets. This means we won’t be seeing the ESTLI or NMI for some time, but we will still have prices to track.

Surge in throughput puts a dampener on prices

A rush to offload cattle this week has seen yardings surge and domestic cattle prices probe lower. Processors appear to be increasing their activity in response to domestic demand for red meat and offshore beef export prices lifted on supply chain concerns and consumer stockpiling.

East coast cattle yardings have lifted 70% in recent weeks as producers respond to Covid-19 shutdown uncertainty by offloading stock. Throughput levels have gone from running 17% below the five-year trend to 40% above the trend in a matter of weeks (Figure 1).

This week, Victorian store sales were postponed and Meat and Livestock Australia (MLA) have announced some changes to the way saleyard data will be reported with some of the regular indicators becoming unavailable for the foreseeable future.

As of mid-week, east coast cattle categories reported by MLA’s NLRS service were all showing price declines ranging from 14¢ to 37¢. On Wednesdays close, the Eastern Young Cattle Indicator (EYCI) was holding just above 700¢/kg cwt, National Heavy Steer was off 8¢ to 329¢/kg lwt and in a little bit of bright news the National Medium Cow managed a 4¢ lift to 253¢/kg lwt.

A couple of weeks back we had heard some suggestions that large food retailers were asking processors to increase product delivery as red meat ran off the shelves of many supermarkets. A look at the east coast slaughter figures shows a definite lift in activity with weekly volumes bouncing 8% off the seasonal low. Despite the gain, east coast slaughter remains 18% under the five-year average level for this time in the season (Figure 2).

Panic buying of beef in the US at the retail level and some concern over the ability for the supply chain to deliver product amidst lockdown has flowed through to higher imported beef prices this week with the 90CL frozen cow lifting 10% to 760¢/kg cwt and putting the benchmark indicator back at a premium to the EYCI (Figure 3).

Next week

In these uncertain times, it is hard to predict from one day to the next let alone a week or more out. However, producers are likely to keep bringing stock forward while the situation remains unclear as cash is going to be king so prices are expected to continue to soften in the short term.

With MLA providing limited reporting into the next month (at least) we will be doing our best to run the analysis on the data that will be available. Stay safe, stay indoors (or on your property) if you can and wash your hands regularly.


The grain must flow

Key Points

Last week the Australian dollar was the major discussion point. The dollar floated like a lead balloon to lows of 55¢, the lowest level since 2001. This meant that our local pricing and Swaps increased dramatically. As much as last weeks fall was impressive, this week the rise has been equally dramatic.

At the time of writing this, the Australian dollar has increased to 60¢ (figure 1). During any other period, this would be considered an unusually strong move, but in the current environment large swings are to be expected.

In the previous weeks, wheat futures had actually been declining but the A$ was providing most of the benefit to local pricing. In this past week however, we have seen futures start to rise, which has somewhat outweighed the rising A$ (figure 2).

The reason for the rally was two fold. The panic buying seen around the world for staples such as pasta has resulted in an increase in demand from flour mills. This can be seen in the market preference for nearby contracts as opposed to further down the horizon. This has led to the forward curve moving from contango to a flat/backward structure.

The other major reason was anxiety related to the supply chain. There is a concern that a major exporter such as Russia or France, would be impacted by lock downs in the coming weeks.

At present agricultural supply chains remain essential around the world. In addition, Russia is unlikely to want to limit the income received through wheat exports at a time when crude oil receipts have fallen.

Mulling over the risk of a disruption to supply chains, I was thinking about recent times when this was a major concern. We haven’t had any human pandemics (except HIV) in recent decades, but an analogous situation could be the annexation of the Crimea in 2014.

There were concerns that this short conflict between Ukraine and Russia would result in export difficulties, the reality was that the grain still flowed. The question will be whether the market will continue to price in the risk of supply chain disruption.

Fundamentally the world is forecast to produce a large crop during the coming year, albeit with the share of production held by exporters declining. This year is however likely to be one of extreme uncertainty, and a good grain marketing strategy is important.

Remember to listen to the  Commodity Conversation podcast by Mecardo

What does it mean/next week?:

I don’t know what will happen in the next week, but I’d put money down that it will be volatile! At a local level grain prices remain strong.


Wool has a steady week

Following last weeks drama, the wool market found support and when all is considered, performed well. The finer microns led the way with buyers keen to purchase in the wake of possible total auction room shutdowns in the future.

Concern was noted in the AWEX report that the Covid-19 impact could eventually close sales altogether. In an attempt to get as much wool into the processor’s pipeline before any potential total closure of sales, in the week that was to be the Easter recess, an additional sale has been scheduled.

Supply ex-farm could also be impacted in future weeks. The offering of circa 5.7 million kgs this week came from approximately 1.3 million sheep. Any disruption to shearing teams as a means of preventing group contact could see this supply interrupted or in a worst case scenario, halt.

The Eastern Market Indicator (EMI) gained 4 cents to close at 1,442 cents. The Australian dollar continued its roller-coaster performance and rallied almost US$0.035 cents to be quoted on Thursday at US$0.592. This didn’t help buyers, with the EMI in US terms up 53 cents to 854 cents.

With fewer fine wools the Western Market Indicator struggled, and by weeks end gave up another 26 cents to close at 1,512 cents. WA brokers passed in 19.8% of the 8,089 bales offered, selling just 6,485 bales.

Of the original roster, 11% was withdrawn prior to sale by growers, resulting in a similar offering to last week of 42,934 bales. The pass-in rate fell to 14.3%. nationally leaving 36,790 bales cleared to the trade.

This week the total sales value was $55.35 million (up almost $9. Million on last week) or $1,505 per bale, exactly the same per bale value as last week.

After holding well in the last couple of weeks, Crossbred types eased marginally. The Cardings indicators were a mixed bag, with 17 & 34 cent falls in Sydney & Fremantle respectively, while Melbourne posted a 20 cent gain.

The week ahead

Again a large roster is listed for next week with 45,810 bales scheduled and all centres selling on Tuesday & Wednesday only.

There seems a level of buyer commitment at these readjusted prices, and with supply concerns going forward, the market should at least hold steady next week.