Tag: Commodity

A cut in China livestock tariffs a big deal…or not

According the Australian Livestock Exporters Council (ALEC) it was agreed last week that China are going to cut the 10% tariff on live feeder and slaughter sheep and cattle imports by January 2019. Is this a big deal, or not?

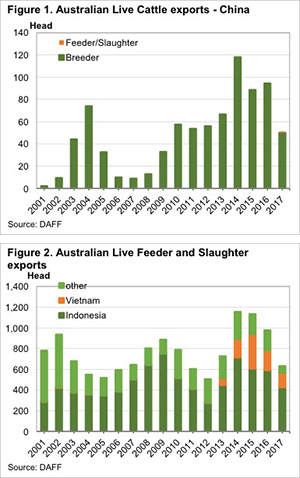
Breeding cattle dominate the Australian live export trade with China. Last year Australia had its second biggest year on record for breeder cattle exports, with 94,341 head shipping out (figure 1). There has been no tariff on breeder cattle exports for some time.

The latest announcement refers to the cutting of the tariff on slaughter and feeder cattle. This is a market which has only just started to move. For the year to October, feeder and slaughter cattle exports to China have totalled just 1,195 head. This is 2.3% of total export to China.

The abolishment of the 10% tariff on feeder and slaughter cattle exports to China will make cattle 10% cheaper for Chinese importers, while Australian sellers will receive the same price. In reality, when tariffs are removed (or applied), the benefit is split between seller and buyer, so there should be some price rise at the exporter end as well, which will no doubt benefit growers.

So where will these cattle come from?  There is competition for China in the feeder and slaughter cattle market. The main player is obviously Indonesia, while Vietnam has grown in the last five years to be easily the second largest importer of Australian live cattle.

Figure 2 shows just how large the Indonesian and Vietnam markets are compared to China. As such it would take a very large push to see Chinese live export demand start to impact prices in Indonesia and Vietnam.

The feeder and slaughter cattle which have been exported to China were actually sent out of Portland earlier this year. This is where many of the breeder cattle which are sent to China come from, and increasing live exports could add support to feeder and slaughter cattle prices in the south when a boat is going.

The 10% tariff was also lifted on sheep, but sheep exports to China don’t even rate a mention in the data.  They are lumped in with ‘other’.

Key points:

  • China have lifted the 10% tariff on live feeder and slaughter cattle and sheep imports from Australia.
  • The current trade with China in live feeders and slaughter cattle is very small, but could grow with opening of the trade.
  • Over time increasing demand for beef in China is likely to see the market grow and support prices.

What does this mean?

The lifting of the tariff from China is not going to see a rapid jump in prices tomorrow. It is an indication, however, that China are serious about taking more live cattle from Australia to bolster beef supplies. While the market is currently very small, any opening up of trade is good for cattle producers, as boats create competition and support prices.

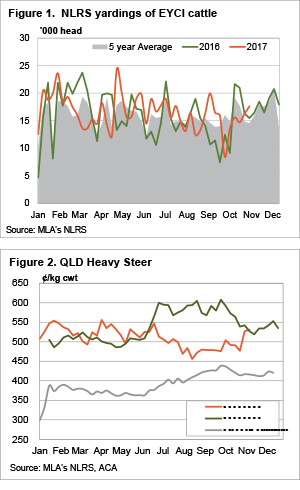
Figure 1 shows that breeder cattle exports have grown rapidly in some years, so don’t be surprised if you start hearing more and more about boats going to China.

Lift in QLD throughput brings East coast back to average

Robust northern cattle prices are attracting stock to the saleyards again this week in Queensland. Although, East coast throughput is sitting at fairly average levels for this time of the season as higher than average northern states yardings are offset by below average levels in the southern states.

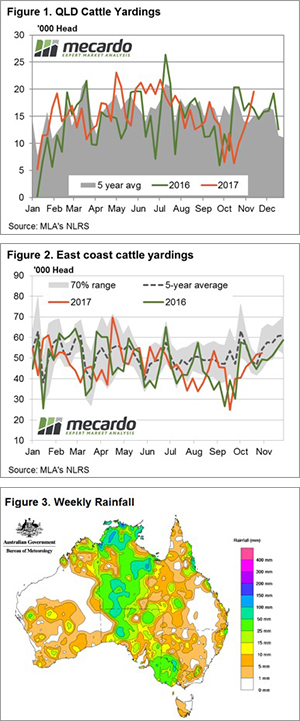
Figure 1 shows the steady rise in Queensland cattle yardings since mid-October and based off last week’s figures we saw another 27% gain in cattle at the saleyards this week. Queensland Restocker, Feeder, Vealer, Medium and Heavy Steers all fetching the strongest prices for their categories across the country this week, so it is probably no surprise that we are seeing producers bring forward supply in the Sunshine State.

Queensland yardings sitting 28% above the five-year average for this time of the season and the above average throughput in Queensland and NSW, which has this week’s throughput 7.5% higher than average, has been offset by lower than average throughput in Victoria and South Australia, at 46% and 40% below their respective average levels. This combination of East Coast yarding levels offsetting each other, saw broader throughput at just 3% below the five-year average for this week in the season – figure 2.

National saleyard cattle prices were relatively subdued this week, with most indicators not varying beyond a plus or minus 2% swing. The Eastern Young Cattle Indicator (EYCI) is virtually unchanged on the week at 578.5¢/kg cwt, while the softest national category was the Heavy Steer Indicator, off 2.3% to 279¢/kg lwt. National Trade Steers were the best performers, closing up 1.8% to 304¢/kg lwt.

In the West, young cattle fared a little better with a 3.6% rally to nearly match the EYCI level, to rest at 575¢/kg cwt. The benchmark beef export indicator, the 90CL frozen cow, finished the week back above 600¢ for the first time in seventeen weeks.

The week ahead

Some very good falls were noted through SA, NT and Western Victoria noted this week (figure 3) and the forecast for next week is for further rain to cover much of Queensland, NSW and Eastern Victoria with levels noted between 50-100 mm in many places.

Good coverage like this and solid export price levels will mean it’s unlikely to see cattle prices soften too much across the nations for the short term.


A time for inward reflection

The market continues to trade with a lack of strong fresh information. The real focus now is on what is happening locally. We continue to sit at strong local levels, but how long will it last?

On the global stage, Chicago wheat futures took a tumble this week (figure 1), returning to levels from the beginning of the month. The market continues to trade on the large global stocks, and eyes will be on export numbers to determine how quickly end-stocks will be depleted in the major exporters. As it currently stands without increased weather woes in the northern hemisphere there is likely to be little in the way of upward momentum.

At a local level, prices have been trending downwards to flat (figure 2) during November. However, across the board, APW1 prices have fallen substantially since the beginning of October.

  • Port Kembla -$39
  • Geelong -$30
  • Adelaide -$18
  • Port Lincoln -$20
  • Kwinana $-14

On the first weekend of November, an unseasonal frost event impacted Victoria. Our discussions with numerous consultants point to major losses to cereals. This is yet to be reflected in pricing with Geelong trading lower than the beginning of the month.

During October strong rainfall events have added some confidence to the summer sorghum crop, which reduced the concerns that domestic feed consumers had. This has led to a fall in basis levels (figure 3), especially in the areas which are within a potential drawing arc of NNSW/SQLD. We have highlighted the risk in pricing levels falling as we advance into harvest, these are worth re-reading.

Lock in premiums, keep exposure to the market

Wheat seasonality: Imitation is the sincerest form of flattery

Let’s look back at historical basis

What does this mean?

The key concern we see, is the status of the crop in Victoria. It has been two weeks since the major frost event, which is considered a 1 in 20-year event. The crop was looking fantastic in the Western Districts, and to see it fail so close to harvest, is completely heartbreaking and devastating. The full extent of the damage will be only be realised when the header goes into the crop.

Go west, where the lambs are cheap

It could be the beginning of the spring flush, or it could be another blip in what has been an exceptional spring for prices. The rainfall this week might also have something to say about lamb prices in the east, but in the west they look like good buying.

There is an interesting east/west paradox going on in the lamb market. In the east restocker lambs are trading at a 50-90¢/kg cwt premium to trade lambs. In the west, trade lambs are priced at 542¢/kg cwt, and restocker lambs at 489¢.

If we work on a 16kg cwt restocker lamb, it makes east coast lambs $122/head with a $5 skin. In the west, the same lamb is worth $83. Historically this is a decent price, but it brings shipping sheep from west to east into play.

Despite yardings falling this week, prices have eased. The Eastern States Trade Lamb Indicator (ESTLI) lost 16¢ to 611¢/kg cwt in the week to Tuesday, but as shown in figure 1, remains well above last year’s levels.

Mutton markets defied the downward movement, with Victorian and NSW remaining solid at 466 and 450¢ respectively. Vic and NSW mutton values have rallied 25% in the last month with demand seemingly the driver (figure 2). Figure 2 also shows that in South Australia mutton is only 330¢, which makes them cheap, and worth shipping to Victoria.

The week ahead

Major lamb districts in Victoria and South Australia have seen exceptional rainfall in the last few days. The rain is likely to see lambs held back, especially if the market eases as Western Victoria and South-East SA are likely to be green until Christmas.

Slaughter figures will tell the tale of lamb supply, and give some pointers to what might happen in the New Year. But don’t be surprised if after this rain the spring flush of lambs is lighter than normal.

Another record for wool.

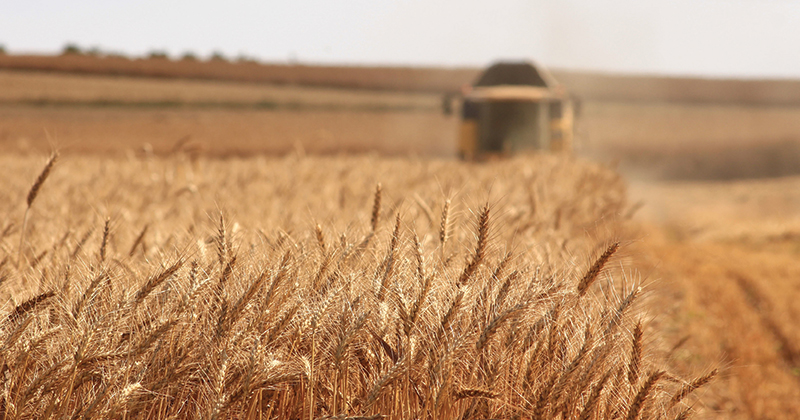
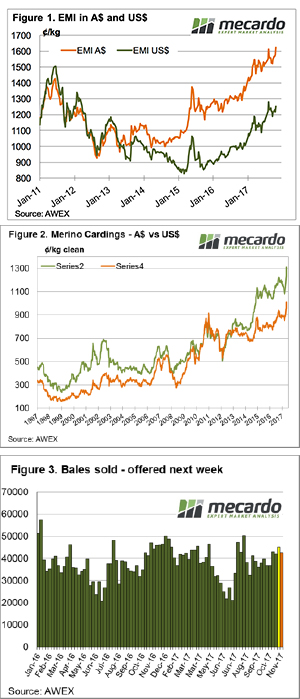
AWEX identified an interesting statistic this week; the turnover of wool sold this week of $96 million was the largest since 2002. The kicker is that while this week it was generated by the sale of 49,000 bales, in 2002 it was on the back of an offering of 74,500 bales. So, a similar $ value heading back to rural Australia but 33% less bales produced.

It was a steadier week with the Eastern Market Indicator (EMI) finished the week at 1,683¢, gaining 2 cents and AWEX reporting this another new record high in Australian dollar terms. The Australian dollar was slightly lower over the week, with the EMI in US$ terms losing 13¢ to end the week at 1,279¢.

Again, a small pass-in rate this week of only 3.2% of the offered bales, resulting in 49,009 bales cleared to the trade. This is one of the largest weekly sale volumes for this selling season, with only the first week after the winter recess larger. Fig 3.

Some of the recent “heat” dissipated from the market this week with reports of “mixed results” where quality again was a factor; or more accurately lower quality wool at times struggled. This has been a pattern for the year however in recent weeks when the market rallied lower grades were supported.

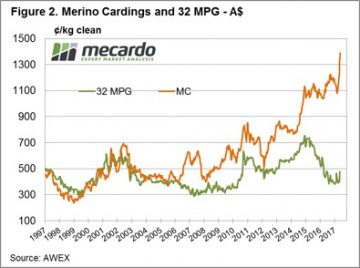
Crossbred wool fell sharply losing as much as 50 cents reflecting the volatile nature of this sector. In contrast, Cardings continue to improve and set new records with all centres showing strong lifts across the week.

We have commented previously that the current market conditions are unique in our time of observation. Supply is moving through the system quickly; that is there are little stocks held either on farm, in broker stores or in mills. Sheep farmers are experiencing record income inflows; with not only wool prices good but so too are sheep and lamb prices. This will mean that any retracement in price in the future will be met with “cashed up” wool producers holding back wool from the market and reducing supply to processors.

As we said, these are unique times where it could be argued that the producer is able to influence the market by withholding supply. The qualifier is that any supply “squeeze” may have short term market influence but it is unlikely to be a long term positive factor on price. In the end, customers will adjust orders to meet supply and pay a price that works for their customers at retail level.

The question of “when or if” the market reaches a top is coming to mind now, we know markets don’t rally forever and that they don’t track sideways for long either. Mecardo had a look this week in the article What is the risk in the wool market at present

The week ahead

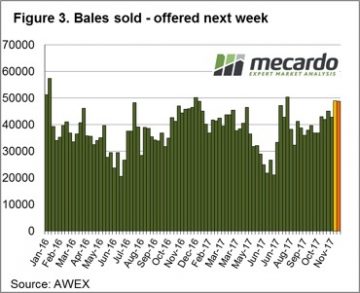
The big offering this week is to be followed by another 48,700 bales rostered for sale next week across the three selling centres (Figure 3). The roster then lists 44,000 for the following two weeks. Of note is the strong report from Fremantle this week, generally a solid market on Thursday in W.A. with the 3-hour time delay to the East Coast is a good lead for next week.

WASDE & Indian barriers

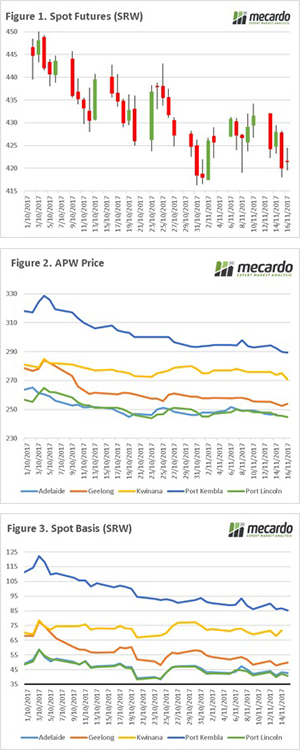
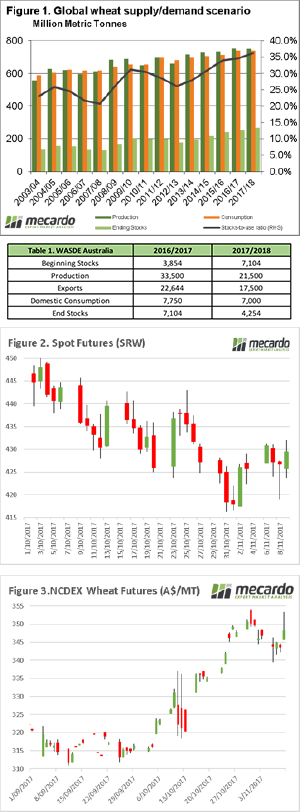
The US Department of Agriculture released their World Agricultural Supply and Demand Estimates overnight. In this week’s comment, we will take a look at the impact on wheat, and report on new import barriers being erected in India.

In last week’s comment, I mentioned that this report would be released, and that there would be little in the way of surprises. This has largely been the case, with no major changes occurring. Unsurprisingly, the Russian crop was further increased by 1mmt, to a record wheat harvest of 83mmt. All in all, without beating around the bush, we are still in a world with a glut of wheat (fig 1). There are arguments that a large proportion of this stock is in China and not available to the export market, however the reality is that global prices are likely to stay depressed for some time.

The USDA have a relatively poor performance when it comes to forecasting Australia, and we tend to believe that the WASDE is usually around 2 months out of sync with reality. In table 1, the WASDE details for Australia are detailed. The items which stand out for future revision for me are:

  • Beginning stocks: These are likely too high, and after such a strong export program this is likely to be revised back close to 5-5.5mmt.
  • Production: USDA remain on the high end of the spectrum when it comes to Australian forecasts. A final production figure closer to 7mmt is more likely.
  • Exports: An export program of 17.5mmt is extremely ambitious for the coming year, and when production and beginning stocks are brought back to reality will be a hard task to complete.
  • Domestic consumption: The domestic consumption figure is sitting on the previous ten-year average, however this year there are a record number of cattle on feed.

So how did the WASDE report impact the markets? The answer is unfortunately for growers is minimally (figure 2). There was little in the way of surprises, and the report largely met trade expectations. After some short covering in the lead up to the report, the market regained it’s losses and is 5¢/bu or A$1 higher than this time last week.

A couple of weeks ago I flagged in the comment, “An Indian Summer”, that the Indian government was likely to implement a 20-25% import duty on wheat. In the past two days, the import duty on wheat was set to 20%. This is in place to discourage imports of wheat, and give positive price signals to local growers. In figure 3, Indian wheat futures on the NCDEX exchange are plotted, and we can see that yesterday the market started the day at A$345 shortly hitting A$353, and ending the day up A$3.

Although we don’t regularly examine pulse markets, a massive duty of 50% has been applied to peas. This is largely to disrupt the import from Canada, but for pea growers in Australia this will be felt.

What does this mean?

The November report is out of the way, and the December report is largely void of any worth. This means that by now and February the only influences on the global market from a fundamental point of view with any value will come from either Australia or South America.

We are going to have to wait until the northern hemisphere weather risk period to see any substantive rallies in the futures market. This does however provide opportunities for consumers to hedge values, or for growers to take out long swap positions.

Young cattle supply up but
Queensland prices still on the rise.

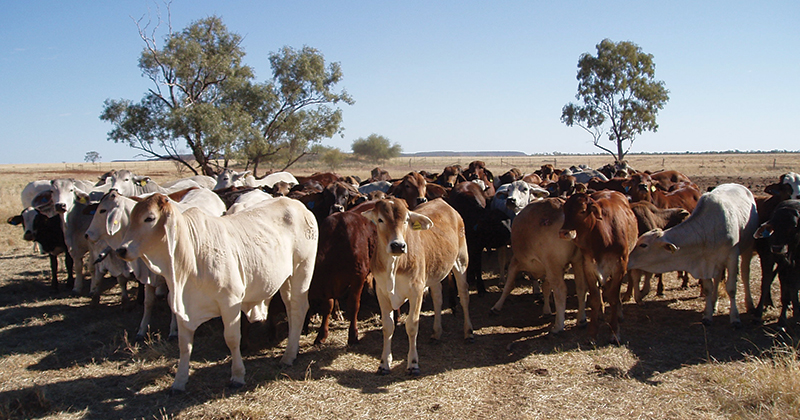
The cattle market stalled for young cattle this week as more rain fell in part of NSW and Queensland, but supply managed to improve.  While young cattle supply was a little stronger, this didn’t stop some solid rises in some interesting indicators.

We are still coming to grips with Meat and Livestock Australia’s new weekly stats, which come out on a Wednesday, with supply data to last Friday. For yardings figures we find it a little hard to match prices with supply, as we are running about 4 sale days behind.

Anyway, what we do know is that young cattle supply in Eastern Young Cattle Indicator (EYCI) saleyards was up 8% in the week to Thursday (figure 1), and this halted the rise in the price, as it stalled at 578¢/kg cwt. In fact, EYCI yardings hit their highest level in 8 weeks. While the EYCI eased marginally, it remains close to its highest level in 15 weeks.

The Queensland Cattle Market Index has been catching our eye, it hit 307.6 points this week. Heavy steers helped to drive the QCMI, as prices rallied 50¢ in the past two weeks to hit a 19 week high of 531¢/kg cwt.

Figure 2 shows that Queensland Heavy Cattle are not far off the price of this time last year, and they are the most expensive heavy cattle in the country. The Queensland 100 day grainfed steer over the hooks indicator ticked 3¢ higher this week, but is languishing behind at 507¢/kg cwt.

The week ahead

It looks like it’s going to be relatively dry for the coming week, on the east coast at least, which might see prices track sideways. There is a little upside left in the slaughter cattle market if export prices remain good, but young cattle markets might find it a little harder to keep rallying without more rain.

Mixed market at Spring crossroad

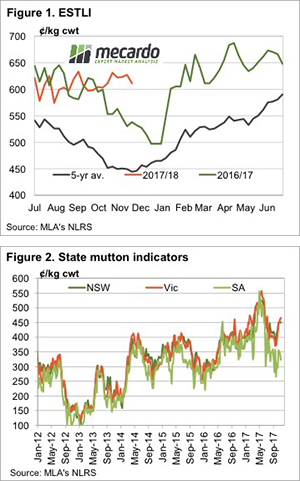
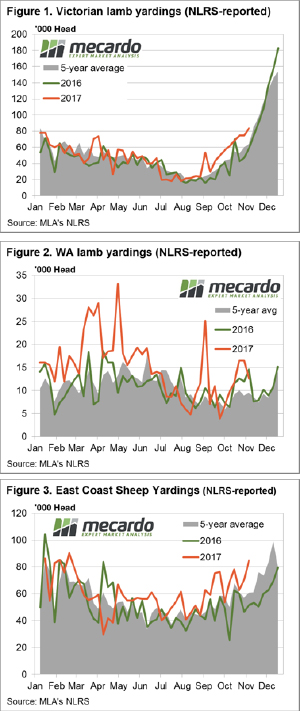
A number of mixed market signals this week across state saleyards for sheep and lamb, as the seasonal Spring price decline looms. Needless to say, on a countrywide level all categories posted price increases between 0.2% to 3%, apart from Restocker Lambs with the national saleyard indicator off 1.2% to 679¢/kg cwt.

The Eastern States Trade Lamb Indicator (ESTLI) was up 1.3% to 628¢, a gain mirrored by the National Mutton Indicator which staged at 1.4% lift to 422¢/kg cwt. Victoria was the only state to show significant increases to lamb throughput this week, with a 12% rise in yardings to see over 83,000 head recorded – Figure 1. All other states registered flat to lower lamb throughput with the East coast lamb throughput tracking sideways.

This was not the case in the West, as producers responded to last week’s drop in trade lamb prices to see WA lamb yardings off 23% – Figure 2. The tighter numbers are giving the Western Australian Trade Lamb Indicator a boost, up 18.5% to 520¢, although it is still sitting over $1 below its East coast counterparts.

Mixed signals were received in mutton markets too this week as higher East coast sheep throughput unable to dampen prices, signalling demand remains firm on the Eastern seaboard. The East coast saleyards reporting a 20% lift in numbers to 84,600 head, buoyed by higher mutton yardings across all of the Eastern states – Figure 3. In contrast, WA mutton markets are showing a textbook response to higher mutton supply, with yardings up 22% and the WA mutton indicator off 2.3% to 304¢/kg cwt.

The week ahead

It’s not uncommon to get mixed signals as markets begin a change in trend. Certainly, the increasing lamb throughput for Victoria has a way to play yet, as we sit about mid-way through the Spring flush. The seasonal supply boost as we head toward Summer should start to weigh on the ESTLI in the next week or two, particularly as it begins to dry out in the south.

The rainfall pattern expected for the week ahead broadly replicates what we saw last week, although slightly lighter falls are expected for NSW while SA and Eastern Victoria are set to benefit from a bit more moisture.

China driving beef exports in October

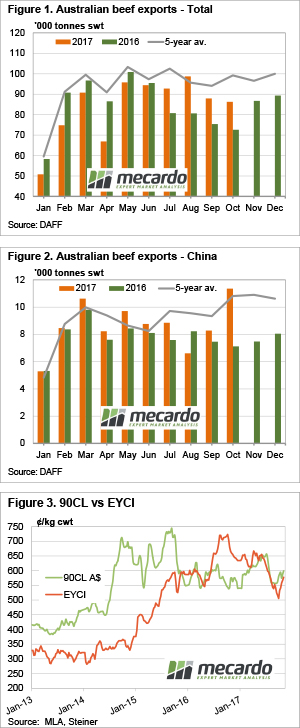
It has only been a week since China’s ban on a number of Australian beef exporters was lifted.  Without the ban, beef exports could be expected to surge in November, but despite weaker total exports, the trade with China has already hit a two year high in October.

We continue to bemoan the lack of weekly slaughter data, export data can be a bit of a proxy for beef production. Total beef exports for October fit nicely with the theory that cattle supply has been tighter, and pushing prices higher.

Figure 1 shows that while Australian beef exports remained very strong relative to last year in October, exports did decline relative to last month and winter figures. On average total beef exports rally in October as cattle supply improves, but rather than a 5% increase on September, we saw a 2% decline (figure 1).

Changes in beef export volumes to Japan and the US were broadly in line with the total trends. This is expected as Japan and the US accounted for 48% of total beef exports. There were a couple of big movers however.

Exports to South Korea were much lower, down 18% on September and 20% on October last year. Making up for lower exports to South Korea were surging exports to China (figure 2), which were up 37% on September and 60% on October last year. In fact, despite the ban on some processors, beef exports to China were at their highest level since December 2015.

China failed to move into third place as our export destination, but the 11,353 tonnes fell just 15 tonnes short of South Korea.

What does this mean?

Weaker cattle and beef export prices (figure 3) in September and October may have helped drive increased exports to China, as it is a price sensitive market. It will be interesting to see if November and December exports to China are as strong, with a recovery in prices likely to have been passed on to importers.

Other major export markets generally have more money than China, and with higher prices and a smaller supply, Chinese exports may subside despite the reopening of the market to the banned processors.

It is good to see demand for Australian exports is still strong, and the Chinese are seemingly poised to soak up supply when prices get cheap enough. This suggests there might be a solid floor in the market until there is a heavy increase in supply.

No need for Rekindling, wool market is on fire

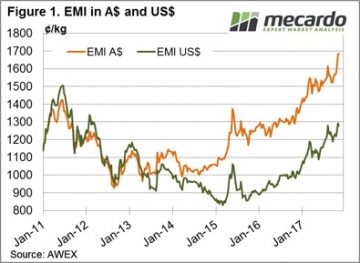
What a week, Rekindling wins the Melbourne Cup while the wool market catches fire! If we thought last week was good when the EMI jumped 45 cents, this week the increase was 58 cents – more than a 6% increase in 2 weeks.

The Eastern Market Indicator (EMI) finished the week at 1,681¢ with AWEX reporting this another new record high in Australian dollar terms. The Australian dollar was slightly lower over the week, with the EMI in US$ terms posting a rise, also of 40¢ to end the week at 1,293¢. The EMI in US$ terms is edging higher, however it is still well off its previous record of 1504 cents set in July 2011.

Only 1.3% of the offered bales were passed-in, resulting in 42,846 bales cleared to the trade. Slightly fewer bales were offered compared to last week and therefore fewer sold, however this volume is as expected with the spring deliveries arriving, so all in all this clearance is a good strong market signal.

Looking at the market, demand was excellent with AWEX reporting lots “across the whole Merino spectrum were hotly contested”. It was also noted that discounts for “wools with inferior test results” disappeared as buyers scrambled to secure market share.

Some of the stand-out performers deserve special mention; the Cardings indicator lifted on average 63 cents across the three selling centres, to post a record level. It’s worth reflecting to compare to the dismal days of 1999 when the Cardings indicator bottomed at 236.

Another sometimes over looked type is the 32 MPG, this week it lifted 81 cents or 20%, an extraordinary move in one week.

In fact, the entire crossbred range lifted by 50 to 80 cents, slightly over shadowing the strong rise in the Merino section in a week of records.

The forward market as expected also kicked into gear, with buyers showing confidence in the near-term outlook by bidding out as far as August 2018; as an example, 19 MPG for July 2018 traded at 1870 cents.

The week ahead

49,486 bales are rostered for sale next week across the three selling centres (Figure 3). The roster lists 41,000 and 44,000 for the following weeks. It’s hard to see that this future offering will have a negative effect on the market following this week’s bull run.