Tag: Commodity

Feeder Steer Forecasting

Key points


  • An annual average National Heavy Steer price of 335¢/kg lwt during 2020 would suggest forecast National Feeder Steer price of around 385¢/kg lwt, provided grain prices continue to soften toward the 2020/21 harvest.
  • A forecast of 345¢/kg lwt for Heavy Steers in 2021 places the National Feeder Steer forecast nearer to 400¢/kg lwt.
  • The difficulty in forecasting for the 2021 season is the long-term impact of Covid-19 on global beef, global grain prices and the A$.


Article

In a Meat and Livestock Australia (MLA) funded webinar that Mecardo delivered for Holmes and Sackett on restockers last week we were asked a great question on what our national heavy steer forecast means for feeder steer prices for the 2020/21 season. This piece looks at the relationship between heavy steer, feeder steer and feed grain prices and what it can tell us about feeder steer forecast levels for the next few years.
To access a copy of the MLA restocker webinar recording click here.

The Mecardo National Heavy Steer (NHS) forecast model is used to predict the annual average price of heavy steers in Australia using predictive inputs to the model such as the A$ level, global beef prices and domestic supply considerations.

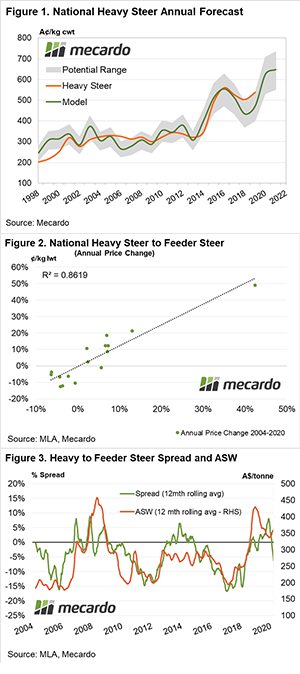
The current forecast for 2020 is an annual average of 625¢/kg cwt (approx. 335¢/kg lwt), which is based on an A$ annual average of 67US¢ and an annual average US Live Cattle futures price of 110US¢/lb (Figure 1). At the moment both of these inputs are much lower on the back of Covid-19 speculative selling, with the Aussie dollar under 60US¢ and US Live Cattle below 100US¢/lb.

A comparison of the annual price change for National Heavy Steer and National Feeder Steer shows that there is a very strong correlation between the two (with an r2 of 0.8619) (Figure 2). This demonstrates that we can safely use the Nation Heavy Steer forecast model output to get an idea of the likely price forecast for National Feeder Steers, once we allow for how climatic factors and feed cost influence the historic spread between heavy steer prices and feeder steer prices.

Analysis of the percentage spread of heavy steer to feeder steer compared to the ASW price (smoothed over a 12-month average) highlights that during periods where there is a low feed price environment, the heavy steer moves to a discount of approximately 15% to the feeder steer (Figure 3). 

The big unknown at the moment is the long-term impact of Covid-19 on global beef, global grain prices and the A$. Local grain prices rallied last week despite softer international grain prices due to the collapse in the A$ under 60US¢.

What does it mean?

Assuming an annual average National Heavy Steer price of 335¢/kg lwt during 2020 would suggest an annual average National Feeder Steer price of around 385¢/kg lwt, provided grain prices continue to soften toward the 2020/21 harvest.

For 2021, the Mecardo National Heavy Steer model forecasts an annual average price of 640¢/kg cwt (345¢/kg lwt) but this is based on an A$ of US70¢ and US Live Cattle at 115US¢/lb. If the Covid-19 impact is short-lived and the A$/US Live Cattle futures can rebound from their current levels, there isn’t any reason why we can’t achieve these forecast levels for the heavy steer. 

Furthermore, based on an assumption of cheaper domestic feed prices and a 15% discount of heavy steer to feeder steers into the 2021 season the feeder steer forecast would be nearer to 400¢/kg lwt.


Ovines succumb to Covid19 concern

Early March saw an increase in throughput as sheep producers responded to record prices but in recent weeks levels have softened. No sign of processors looking to increase slaughter volumes though despite some anecdotal reports that supermarkets are keen to restock after a run on red meat. With the A$ collapse and concern over a Covid19 economic growth hit the uncertainty has filtered through to sheep and lamb prices. 

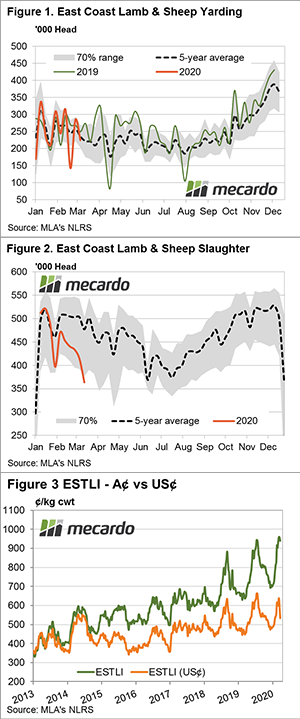
Figure 1 highlights the pattern for combined lamb and sheep throughput across the east coast. After an increase in weekly yarding in the first week of March toward levels that were testing the upper boundary of the normal seasonal range nearer to 285,000 head per week, we have seen it settle back toward more average seasonal levels – Figure 1.

This week I heard of an anecdotal report that a large retailer was seeking an urgent 25% increase in processing of red meat so that supplies could be quickly replenished after a run on product from panic buying preppers. 

However, a look at combined sheep and lamb slaughter across the east coast shows that there has been no appetite from processors to engage too heavily in the current market with prices so firm. The sheep and lamb slaughter volumes extending to levels consistent with the depths of winter, running at 24% under the five-year trend for this time in the season at around 365,000 head per week.

Prices at east coast sale yards for all categories of lamb and sheep reported by MLA’s NLRS service softened this week in response to jitters around the Covid19 spread. Mirroring the broader moves the Eastern States Trade Lamb Indicator (ESTLI) dipped 18¢ to close at 941¢/kg cwt and the National Mutton Indicator (NMI) shaved off 41¢ to finish at 668¢/kg cwt. 

Panic behavior we have seen at the supermarket spread to international currency markets this week with the A$ collapsing to an 18 year low near 55US¢. While this is unfortunate for those importing farm machinery or offshore inputs it provides a competitive boost for Australian sheep meat producers. Figure 3 highlights the ESTLI in both A$ and US$ terms with the sharp fall in the local currency allowing lamb prices in foreign buyer terms coming off 10% just this week.

What does it mean/next week?:

Given the depth of concern over the current global economic situation it’s hard to see sale yard prices rallying too much in the short term. A look at the rainfall forecast for the next week isn’t showing enough to encourage restockers too much further either so its likely we will see price pressure to continue in the next few weeks.

Supply up on Covid concerns

The stellar run for the Eastern Young Cattle Indicator (EYCI) came to a halt this week, with increased yardings forcing the EYCI lower. What wasn’t taken into account, however, was the tanking Australian dollar seen late in the week, which should 

add support.

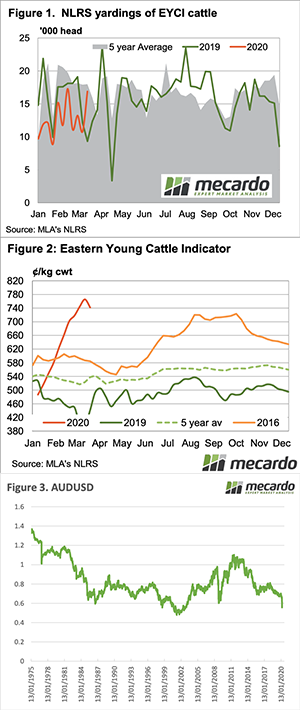
As reported earlier in the week, Australian cattle prices have been defying global trends as the drive to restock trumps demand concerns. This week we saw young cattle yardings increase to their second highest level for the year (Figure 1). Although, they still remain lower than the average for this time of the year.  

Stronger supplies saw the EYCI weaken 24¢, but figure 2 shows it is still in previously uncharted territory. While cows remained strong, it was heavy and medium steers which moved higher this week.  

It might have been export demand driving the heavier end, but there were also reports of cattle being bought for mincing. Panic buyers stripping the shelves is seemingly having a short term impact on demand domestic beef.

In WA, the Western Young Cattle Indicator sits just under 700¢. Cattle supply in the west is generally tight this time of year, and this, along with strong east coast prices, is giving WA values plenty of support.  

The talk of the markets was the tanking Aussie dollar. The AUD move lower than GFC levels, sitting just above 55US¢ at 2pm on Thursday (Figure 3).  Such is the volatility in markets, the AUD was back to 57US¢ at 10pm. The AUD is still down 7US¢ on last week, and this might see some support for cattle prices next week.   

Remember to listen to the Commodity Conversations podcast by Mecardo

Next Week.

While the lower Aussie dollar is good for finished cattle prices, it also pushes grain values higher.  And as you would have seen from the article on feeder prices this week, grain prices have a strong negative relationship with feeder cattle prices. The uncertainty in the market in general means we might have seen the top for now, but supply is only going to get tighter from here, especially for finished cattle.

Wheat futures rally to extreme levels (in A$ terms)

Key Points

The markets have gone truly bananas. In a good way for growers but not necessarily for consumers. In the past week, Chicago wheat futures have risen to the highest level since 2012 (in A$ terms). This provides a great opportunity for farmers to start their 2021 marketing at extremely strong levels. 
Let’s start where the real excitement is. The A$. Australian agriculture for the most part of export orientated; this means that with a lower dollar the local price can rise dramatically due to buying in Australia from overseas effectively being cheaper. 

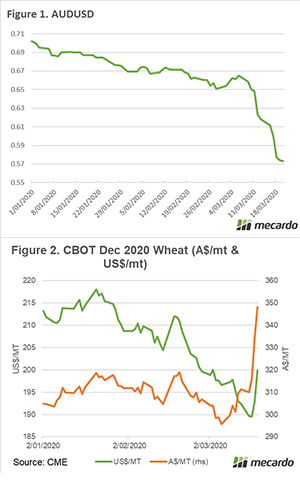
The A$ has been feeling the effects of gravity since the start of the COVID19 crisis. At the start of the year, the expectations from most banks was an A$ in the low to mid 70’s. The mother of all black swan events has caused all forecasts to be wildly wrong. In figure 1, we can see the Australian dollar against the greenback, and it has hit levels not seen since 2002.

So what about grain? In figure 2, Chicago wheat futures for December are displayed in both US$/mt & A$/mt. The market has rallied substantially in both however the rally in Australia dollar terms has been more pronounced.

This is an opportunity for producers. At present, it is possible to book in a wheat swap for the coming harvest at A$347/mt. This is an extremely attractive number historically and places it at the highest level since 2012. 

We advise that all producers enquire with their banks about the option for using swaps for mitigating risk. It is important to get this facility set up, it doesn’t cost anything. It’s better to have it and not need it than need it and not have it. 

Remember to listen to the  Commodity Conversation podcast by Mecardo

What does it mean/next week?:

The market is crazy with a huge amount of volatility. What is going to happen next week? No-one has a clue. We are in uncharted territory, the US dollar is considered a safe haven which has caused a decline in our currency. 

We might find the US response lacking and see an exodus from the greenback. It’s all speculation at the moment, but in reality agriculture seems quite resilient to these times. 

Wool market feels full effect

If last week in the midst of global turmoil the wool market caught a cold, this week it had “full-blown influenza”. Despite the Au$ free-falling, the wool market was hit hard with buyers reducing limits continuing the EMI downturn for the sixth consecutive day.


From the outset, the market was significantly cheaper with 100+ cent falls across the board.

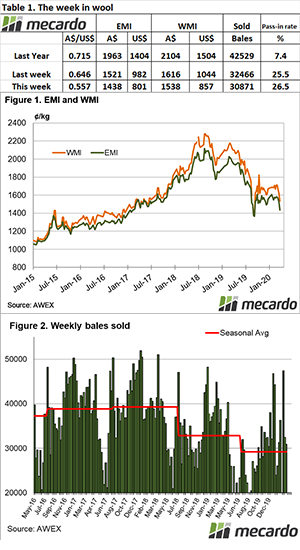
The Eastern Market Indicator (EMI) lost 83 cents or 5% for the series to close at 1,438 cents. The Australian dollar collapsed losing almost US$0.09 to be quoted on Thursday at US$0.557. This cushioned the effect on sellers however the EMI in US terms was down 181 cents to 801 cents. This was a massive 18% fall and the lowest the EMI has been in US$ terms for over ten years. A sign that the global impact on trade is now clearly transferred into the wool market.

The Western Market Indicator performed better than the East, giving up 78 cents on the week to close at 1,538 cents. There were positive signs late on Thursday where the W.A. market clawed back some ground. However, W.A. brokers passed in 34.1% of the 8,066 bales offered, selling just 5,317 bales. 

While just on 50,000 bales were rostered nationally, almost 8,000 were withdrawn prior to sale resulting in 41,986 bales offered. Only 30,871 bales were eventually sold resulting in another high pass-in rate of 26.5%.

This week the total sales value was $46.49 million or $1,505 per bale, this is around $200 per bale lower than the seasonal average.

Crossbred types again showed the only positive moves with small gains in the 30 & 32 MPG’s although the finer crossbreds fell in line with the merino section. The Cardings indicators were not spared falling in all centres by 50 to 80 cents. 


The week ahead

Another large roster is listed for next week for with 49,874 bales rostered, with Melbourne again selling over three days and all centres selling on Wednesday & Thursday.

In “normal” conditions the collapsing Au$ would be a stimulant for buyers to purchase at lower US$ levels. These certainly are not “normal” times, with probably the only certainty that it will be much less than the 49,000 bales rostered that is eventually sold next week.

Supermarket shelves cleared and saleyards are bare too

Not a day goes by at the moment without a fresh picture on social media of empty supermarket shelves after a wave of panic buying. Despite record price levels for many categories of cattle saleyard throughput numbers remain fixed at the bottom end of the normal seasonal range signalling the incentive to hold and rebuild stocks is growing among producers.  

The Eastern Young Cattle Indicator (EYCI) continued to probe higher this week, stretching to 765.50¢/kg cwt as restockers continue to snap up stock. Across the eastern states the NLRS service from Meat and Livestock Australia report strong gains for yearling steers up nearly 10% on the week to close at 381.75¢/kg on a liveweight basis.
The Eastern Heavy Steer indicator is holding firm too just shy of the peaks achieved during the 2016 price rally closing 9¢ higher on the week to finish at 346.5¢/kg lwt – Figure 1. Given the uncertainty around in global beef markets at the moment and the Covid19 inspired sharp selloff in US Live Cattle futures markets in recent weeks the resilience of heavy steer market across the eastern seaboard is comforting.

The east coast cattle yarding trend gives a clue to the cattle price support, with throughput continuing to drift along the lower end of the normal seasonal range. Since the start of the year, the average weekly yarding level has been running nearly 18% below the five-year trend, indicative of the tight season expected in 2020 – Figure 2.

A fairly positive three-month rainfall outlook into the May to July period issued by the BOM last week also continues to provide confidence to restocker buyers with 60-70% chance of above-median rainfall anticipated for much of the nation – Figure 3. It should be noted though that rainfall forecasts for late Autumn issued at this time of the season have a reduced level of accuracy as some of the main climatic drivers are usually in reset mode at present. We probably need to wait another month before we begin to get a more accurate picture of how the autumn break in the south will play out.

Next week

At least we can have a higher degree of confidence in the accuracy of the BOM eight-day rainfall forecast. Unfortunately for producers, this shows limited falls expected in the coming week with most rain limited to the coastal areas around the country.

It wouldn’t be surprising to see cattle markets take a bit of a breather from probing significantly higher in the coming week as the growing spread of Covid19 and its impact on global growth is assessed. Perhaps we see a bit of consolidation while the market shifts to a wait and see approach in the short term.

Crisis? No crisis here.

Oil is crashing, the stock market is crashing, the Aussie dollar is lower, there is a massive spend on stimulus, the whole country could go into lockdown, but what about sheepmeat?  Well, people have to eat.

The ‘people have to eat’ story is a good one, as it is true to an extent. The problem is, people don’t have to eat lamb cutlets for $32/kg, or rack roasts at $36/kg.  If income and spending start to be impacted, it will be sausages and mince instead.  Perhaps that is why mutton is on the move again.

After a brief stall, the mutton rally continued, with the National Mutton Indicator posting yet another record of 729¢/kg cwt this week (figure 1).  At the end of January, lambs were making this sort of money.  At Hamilton today, most sheep sold over 800¢/kg cwt.  The demand for mutton in export markets seems not to have been impacted by Covid19, or the tanking financial markets, yet.

The lamb rally did stall this week but held its ground at record levels.  The Eastern States Trade Lamb Indicator (ESTLI) fell 1¢ to finish Thursday at 960¢/kg cwt.

WA is finally seeing some positive price action, with eastern states buyers competing with local processors.  Figure 2 shows WA mutton is also at record levels, while lambs are just under 800¢.

Supply continues to slide.  Figure 3 shows the combined sheep and lamb slaughter last week hit ‘average’ mid-winter levels.  The flock rebuild appears to be in full swing.

Next Week.

Lamb and sheep producers might be worried about prices easing on the back of weakening demand, but there doesn’t seem to be enough stock out there to pressure the market lower.  With restockers still paying over 1000¢ for store lambs, they don’t seem to be concerned either.


Wool market not immune

Despite the resilience shown over previous weeks by the wool market in the face of the global impact and then the week shut-down of sales due to the cyberattack on the Talman system, this week it succumbed. The accumulated effect of increased volume as a result of the shut-down and the global uncertainty caused the market to record losses across the board.

The Eastern Market Indicator (EMI) lost 41 cents to close at 1,521 cents. The Australian dollar remained under pressure falling 1.6 cents to sit at its lowest level since early 2003 at the close of sales on Thursday at US$0.646. This pulled the EMI in US terms down 52 cents to 982 cents.

Apart from a two week period in September last year, this is the lowest the EMI has been in US$ terms since November 2016.

The Western Market Indicator was in line with the East, giving up 46 cents on the week to close at 1,616 cents, with W.A. brokers passing in 29.9% of the 11,511 bales offered..

There was an unwillingness by growers to sell, with AWEX reporting that while 43,500 bales were offered nationally, this was after 6.2% was withdrawn prior to sale. In the end, 32,466 bales were sold resulting in 25.5% being passed in.

Year to date 126,700 bales fewer have been offered, and 189,700 bales less sold to the trade. There have been 904,828 bales sold however, for a total value of $1,542 million, delivering an average per bale return to growers of $1,704 per bale across all types.

This week the total sales value was $49.93 million, or $1,538 per bale.

Crossbred types showed the only positive moves with modest gains in the 30 & 32 MPG’s; with a note that poorly prepared types found little support. The Cardings indicators again eased in all centres giving up 27 – 40 cents over the week.


The week ahead

Again the roster for next week is large with 50,237 bales rostered, with Melbourne selling over three days to accommodate the larger catalogue and all centres selling on Wednesday & Thursday.

It is unlikely that this volume will come to auction, as growers elect to hold wool out while the uncertainty persists.

Since the sales closed this week, the Au$ has weakened further, quoted at below US$0.63. despite a lack of confidence in predicting anything at the moment, the weaker Au$ and reluctant grower selling will be generally supportive, the question is will that be enough to stem the market decline?

Australian Dollar at the back of the grid

All markets have taken an absolute hammering since the start of March. The closure of many borders and the curtailing of global trade has resulted in red across the entire grid. However, the fall in the Australian dollar has propelled us into pole position.

The Australian dollar has declined rapidly and has fallen to its lowest level since 2008. When there is uncertainty in the global economy there tends to be a move away from our currency. The uncertainty caused by the US banning inbound flights from the EU has really put the jitters on the market.

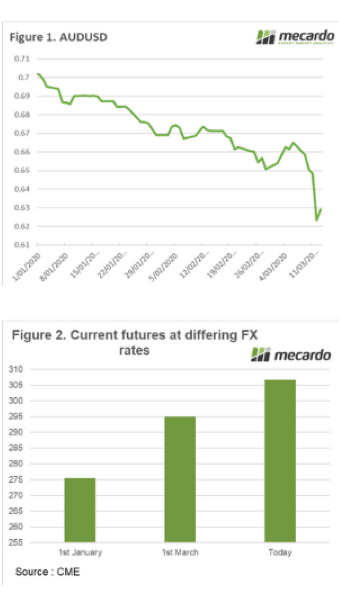
The Australian dollar has fallen from 70¢ to 62.9¢ in the course of less than three months (figure 1). At the start of the year, most of the banks were optimistic and forecasting the dollar at over 70¢. Those forecasts are being rapidly redrawn.

In figure 2 the current December futures price is shown with the fx rate on 1st of January, 1st of March and today. If the exchange rate was the same as the start of the year the swap price for December would currently be at A$275/mt, at present, it sits at A$306/mt.

This provides an opportunity to again lock in a swap value at above A$300/mt. In the current environment of extreme uncertainty the market could go either way. This global pandemic is unprecedented and governments and traders have no real previous lessons to learn from.

What does it mean/next week?:

The Australian dollar has saved grain growers bacon with its recent fall. If we see rises in the dollar then we can rapidly see gains lossed. It is worthwhile having a chat with your advisor about risk management strategies.

Oil be damned

May you live in interesting times. A phrase which absolutely applies to 2020. As well as Coronavirus, we are also an ‘oil war’ between OPEC nations. This has resulted in big moves in the oil industry.

The oil market was falling in recent weeks due to demand disruption caused by reduced trade and drastically falling passenger numbers on air travel. However, instead of curtailing supply the major producers have done the opposite!

The Organization of the Petroleum Exporting Countries (OPEC) had planned to reduce output in order to stimulate prices. However, Russia was unwilling to agree to plan. In response, Saudi Arabia threatened to flood the market with oil.

As the worlds largest exporter this represented a huge risk to pricing as with lower extraction costs (US$8.98), they can sustain very low oil prices for extended periods.

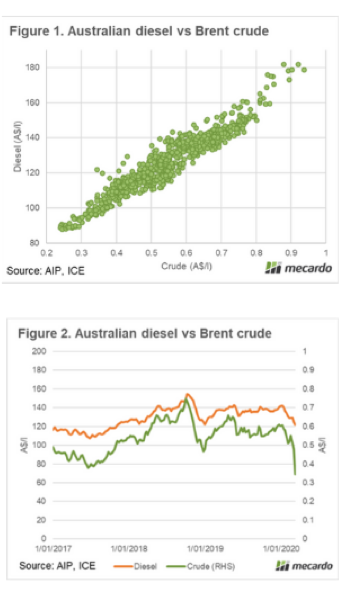
Diesel is derived from crude oil, and any changes to the price of crude will flow to our fuel prices within Australia. When converted to Australian dollars/litre the correlation between crude and local diesel is 0.95, with 0 being no correlation and 1 being a perfect correlation. This can be seen in figure 1.

In figure 2 both crude and oil are displayed in A$/litre. The crude oil price has been creeping down since the start of the coronavirus crisis, however, has seen its largest fall in over a decade in the past week.

Diesel prices have been falling this gradual decline to reach the lowest levels since last January.

What does it mean/next week?:
At a time of low demand for oil, the oil-producing companies have gone against logic and are increasing supply.

Crude oil prices have been absolutely smashed. There is a lag between the fall in crude and diesel prices, however, we would expect that prices will fall further throughout the week if crude remains at current levels.

This is good for my 120km daily commute, but will also be good for those preparing for seeding.