Month: November 2017

Young cattle supply up but
Queensland prices still on the rise.

The cattle market stalled for young cattle this week as more rain fell in part of NSW and Queensland, but supply managed to improve.  While young cattle supply was a little stronger, this didn’t stop some solid rises in some interesting indicators.

We are still coming to grips with Meat and Livestock Australia’s new weekly stats, which come out on a Wednesday, with supply data to last Friday. For yardings figures we find it a little hard to match prices with supply, as we are running about 4 sale days behind.

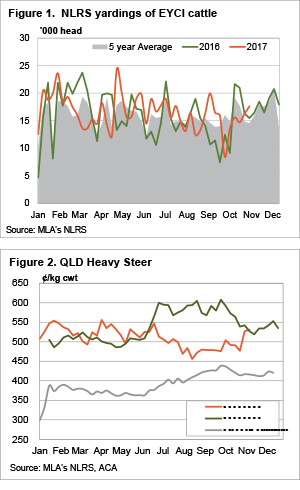
Anyway, what we do know is that young cattle supply in Eastern Young Cattle Indicator (EYCI) saleyards was up 8% in the week to Thursday (figure 1), and this halted the rise in the price, as it stalled at 578¢/kg cwt. In fact, EYCI yardings hit their highest level in 8 weeks. While the EYCI eased marginally, it remains close to its highest level in 15 weeks.

The Queensland Cattle Market Index has been catching our eye, it hit 307.6 points this week. Heavy steers helped to drive the QCMI, as prices rallied 50¢ in the past two weeks to hit a 19 week high of 531¢/kg cwt.

Figure 2 shows that Queensland Heavy Cattle are not far off the price of this time last year, and they are the most expensive heavy cattle in the country. The Queensland 100 day grainfed steer over the hooks indicator ticked 3¢ higher this week, but is languishing behind at 507¢/kg cwt.

The week ahead

It looks like it’s going to be relatively dry for the coming week, on the east coast at least, which might see prices track sideways. There is a little upside left in the slaughter cattle market if export prices remain good, but young cattle markets might find it a little harder to keep rallying without more rain.

Mixed market at Spring crossroad

A number of mixed market signals this week across state saleyards for sheep and lamb, as the seasonal Spring price decline looms. Needless to say, on a countrywide level all categories posted price increases between 0.2% to 3%, apart from Restocker Lambs with the national saleyard indicator off 1.2% to 679¢/kg cwt.

The Eastern States Trade Lamb Indicator (ESTLI) was up 1.3% to 628¢, a gain mirrored by the National Mutton Indicator which staged at 1.4% lift to 422¢/kg cwt. Victoria was the only state to show significant increases to lamb throughput this week, with a 12% rise in yardings to see over 83,000 head recorded – Figure 1. All other states registered flat to lower lamb throughput with the East coast lamb throughput tracking sideways.

This was not the case in the West, as producers responded to last week’s drop in trade lamb prices to see WA lamb yardings off 23% – Figure 2. The tighter numbers are giving the Western Australian Trade Lamb Indicator a boost, up 18.5% to 520¢, although it is still sitting over $1 below its East coast counterparts.

Mixed signals were received in mutton markets too this week as higher East coast sheep throughput unable to dampen prices, signalling demand remains firm on the Eastern seaboard. The East coast saleyards reporting a 20% lift in numbers to 84,600 head, buoyed by higher mutton yardings across all of the Eastern states – Figure 3. In contrast, WA mutton markets are showing a textbook response to higher mutton supply, with yardings up 22% and the WA mutton indicator off 2.3% to 304¢/kg cwt.

The week ahead

It’s not uncommon to get mixed signals as markets begin a change in trend. Certainly, the increasing lamb throughput for Victoria has a way to play yet, as we sit about mid-way through the Spring flush. The seasonal supply boost as we head toward Summer should start to weigh on the ESTLI in the next week or two, particularly as it begins to dry out in the south.

The rainfall pattern expected for the week ahead broadly replicates what we saw last week, although slightly lighter falls are expected for NSW while SA and Eastern Victoria are set to benefit from a bit more moisture.

China driving beef exports in October

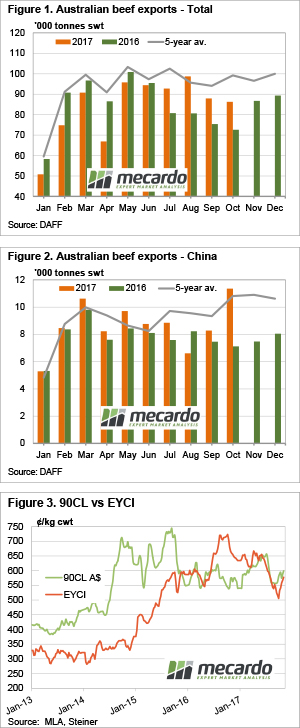
It has only been a week since China’s ban on a number of Australian beef exporters was lifted.  Without the ban, beef exports could be expected to surge in November, but despite weaker total exports, the trade with China has already hit a two year high in October.

We continue to bemoan the lack of weekly slaughter data, export data can be a bit of a proxy for beef production. Total beef exports for October fit nicely with the theory that cattle supply has been tighter, and pushing prices higher.

Figure 1 shows that while Australian beef exports remained very strong relative to last year in October, exports did decline relative to last month and winter figures. On average total beef exports rally in October as cattle supply improves, but rather than a 5% increase on September, we saw a 2% decline (figure 1).

Changes in beef export volumes to Japan and the US were broadly in line with the total trends. This is expected as Japan and the US accounted for 48% of total beef exports. There were a couple of big movers however.

Exports to South Korea were much lower, down 18% on September and 20% on October last year. Making up for lower exports to South Korea were surging exports to China (figure 2), which were up 37% on September and 60% on October last year. In fact, despite the ban on some processors, beef exports to China were at their highest level since December 2015.

China failed to move into third place as our export destination, but the 11,353 tonnes fell just 15 tonnes short of South Korea.

What does this mean?

Weaker cattle and beef export prices (figure 3) in September and October may have helped drive increased exports to China, as it is a price sensitive market. It will be interesting to see if November and December exports to China are as strong, with a recovery in prices likely to have been passed on to importers.

Other major export markets generally have more money than China, and with higher prices and a smaller supply, Chinese exports may subside despite the reopening of the market to the banned processors.

It is good to see demand for Australian exports is still strong, and the Chinese are seemingly poised to soak up supply when prices get cheap enough. This suggests there might be a solid floor in the market until there is a heavy increase in supply.

No need for Rekindling, wool market is on fire

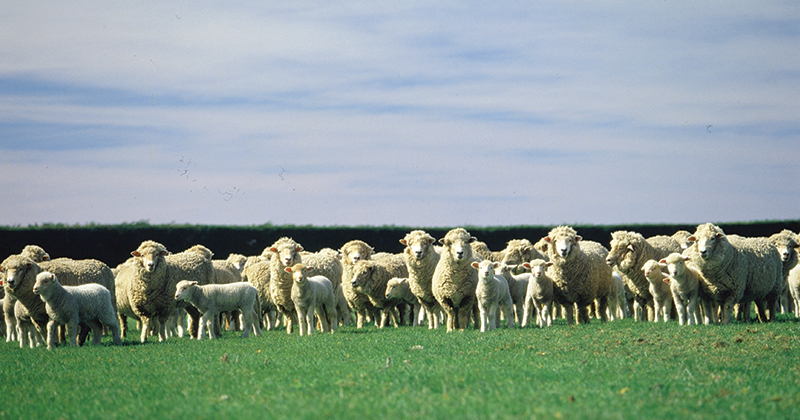
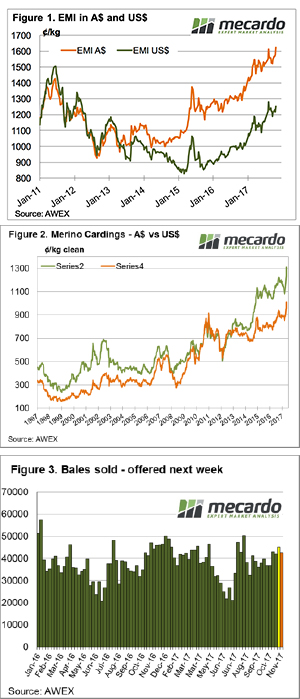
What a week, Rekindling wins the Melbourne Cup while the wool market catches fire! If we thought last week was good when the EMI jumped 45 cents, this week the increase was 58 cents – more than a 6% increase in 2 weeks.

The Eastern Market Indicator (EMI) finished the week at 1,681¢ with AWEX reporting this another new record high in Australian dollar terms. The Australian dollar was slightly lower over the week, with the EMI in US$ terms posting a rise, also of 40¢ to end the week at 1,293¢. The EMI in US$ terms is edging higher, however it is still well off its previous record of 1504 cents set in July 2011.

Only 1.3% of the offered bales were passed-in, resulting in 42,846 bales cleared to the trade. Slightly fewer bales were offered compared to last week and therefore fewer sold, however this volume is as expected with the spring deliveries arriving, so all in all this clearance is a good strong market signal.

Looking at the market, demand was excellent with AWEX reporting lots “across the whole Merino spectrum were hotly contested”. It was also noted that discounts for “wools with inferior test results” disappeared as buyers scrambled to secure market share.

Some of the stand-out performers deserve special mention; the Cardings indicator lifted on average 63 cents across the three selling centres, to post a record level. It’s worth reflecting to compare to the dismal days of 1999 when the Cardings indicator bottomed at 236.

Another sometimes over looked type is the 32 MPG, this week it lifted 81 cents or 20%, an extraordinary move in one week.

In fact, the entire crossbred range lifted by 50 to 80 cents, slightly over shadowing the strong rise in the Merino section in a week of records.

The forward market as expected also kicked into gear, with buyers showing confidence in the near-term outlook by bidding out as far as August 2018; as an example, 19 MPG for July 2018 traded at 1870 cents.

The week ahead

49,486 bales are rostered for sale next week across the three selling centres (Figure 3). The roster lists 41,000 and 44,000 for the following weeks. It’s hard to see that this future offering will have a negative effect on the market following this week’s bull run.

All harvests eve

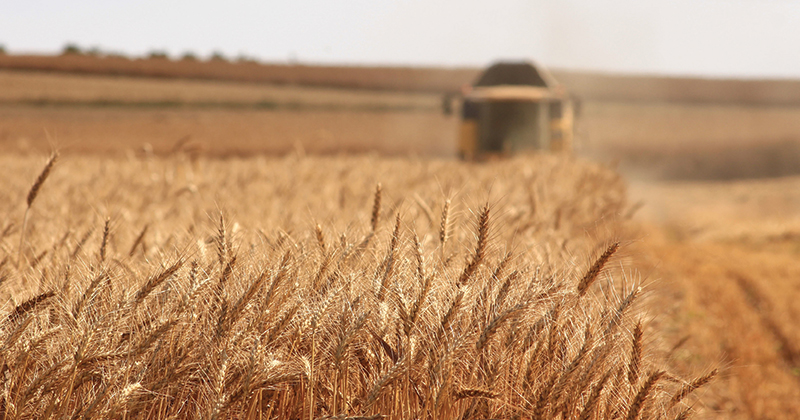
Australian is on the cusp of being full blown harvest, with all states (ex Tasmania) showing some activity. In the coming weeks, harvest proper will be upon us, and we will start to see how accurate the crop forecasts have been.

The futures market saw a sharp drop mid week, with the December 2017 contract falling to contract lows (fig 1). This follows the seasonal pattern which has emerged over the previous two years “Wheat seasonality”. The lack of fresh data, along with a global glut of wheat has given rise to a continued bear market. However, overnight we saw a strong rally (fig 2) which recovered most of the losses of the past few days. This was likely a result of speculators taking profits from short positions, potentially (or hopefully) a sign that the market may be reaching a floor.

The bulk of the harvest is currently centred around NNSW, Queensland, Geraldton & Esperance. In the coming weeks it will move into full swing in the other areas. At present there have been some surprises, with growers getting better results than expected in Qld & NNSW, however the outcome is still going to be well below average.

In local pricing (fig 3), the benchmark APW1 price has seen falls of 1-2%, with South Australia seeing the largest falls. The market however continues to show very strong basis levels, and there are potential downside risks as outlined in our article, “Let’s look at historical basis”. The lack grower forward selling this season, could lead to a pressure on harvest pricing, which we have seen in recent years.

As more certainty on production comes to light, it is advisable to consider trading some physical wheat, as a cover for if basis levels do fall.  At present due to the unknown quality profile, it is prudent to continue to utilise multigrade contracts.

Next Week

In the next week the November WASDE report will be released, it is not expected to bring many surprises and the market will continue to have a neutral to bearish tone. It is unlikely that large market rises will occur prior to the start of the northern hemisphere risk market.

WATLI succumbs to supply, can the east hold on?

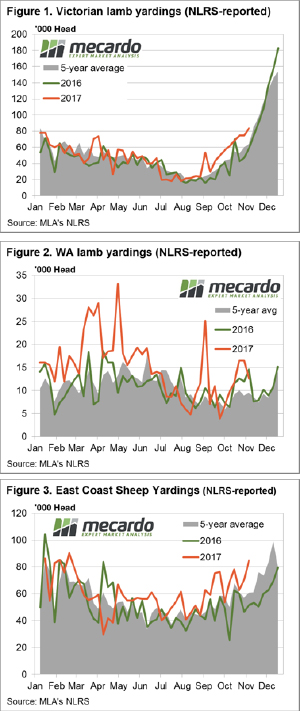
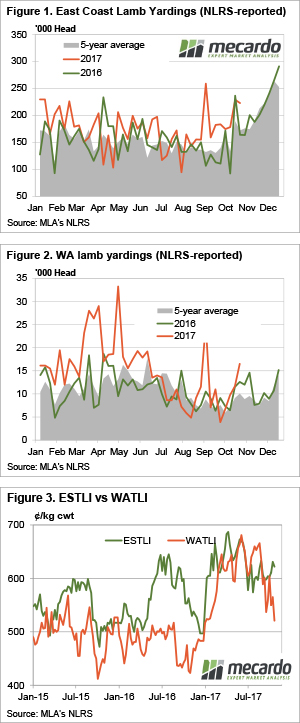
Sheep and lamb yardings had another strong week, with Victorian lambs starting to run. Yet prices continued their solid reluctance to fall, maintaining levels well above last year in the east. Things are easing in the west, but also remain better than last year.

Figure 1 shows east coast lamb yardings for the week ending the 27th, and individual yardings suggest that Victorian lambs are starting to hit the market. Ballarat yardings were up to 40,500 head, while Bendigo remained strong at 34,000 head.

Usually the Victorian lamb run is what pushes yardings higher in November and December, but now it is just adding to already above average yardings in South Australia and NSW. Yardings in WA jumped 41% higher, and are well above normal for this time of year (figure 2).

Higher yardings in WA saw the West Australian Trade Lamb Indicator (WATLI) fall sharply, losing 44¢ to 521¢/kg cwt (figure 3), a nine month low. Despite being lower, the WATLI is 80¢ stronger than this time last year, even with higher yardings.

Last year the ESTLI followed the WATLI lower, after about a month delay. We keep saying we expect the ESTLI to ease in the spring, but there is only a month of spring left, and prices remain strong.

Mutton markets were the star performers this week, with the Victorian Mutton Indicator moving back to 450¢/kg cwt, and NSW not far behind. In contrast SA mutton is lagging around $1/kg cwt behind, or $20 on a 20kg cwt Merino. This suggests that supply in SA is starting to outstrip slaughter space in SA.

The week ahead

We keep saying the ESTLI can’t defy gravity for too much longer; and with cheap lambs in WA, export demand might start to come under some pressure. Last year we saw that the market declined 60¢ from the start of November through to Christmas as supplies ramped up.

Demand is stronger this year, and a 60¢ decline would see markets still at historically strong levels, but price will make current January forward contracts look attractive. More on this next week.

Expensive stores should turn a profit on grass

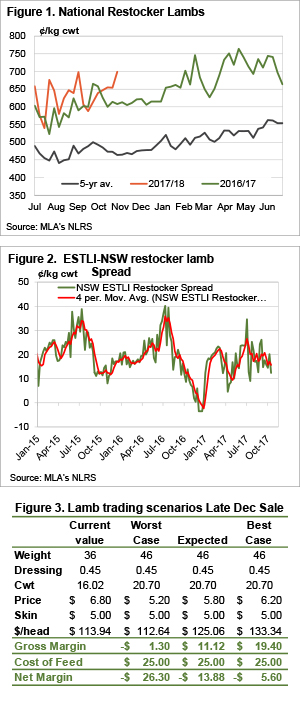
Trade Lamb prices are continuing to defy gravity, and carrying other categories along with them.  Store lamb prices are at record highs for October, and some forward contracts have just been released.  The equation is pretty simple for January, when prices can be locked in, with profits likely to be smaller for lambs sold in December.

The recent strength in lamb prices has restockers starting to get a bit excited.  Figure 1 shows a strong rally in the National Restocker Lamb Indicator last week, as it sits at 699¢/kg cwt.  In dollar per head terms the indicator is sitting around $105 per head.

There is usually plenty of variability in the restocker price in ¢/kg terms, as the average weight can change week to week, and sometimes this doesn’t impact the dollar per head price as significantly as it would for trade or heavy lambs.

Restocker lambs are now at a record level for this time of year, and sitting around 90¢, or 15% above the same time last year.

If we assume trade lambs weigh 20kgs cwt, and restocker lambs 16kgs, and skin values is the same, the spread between restockers lambs and the ESTLI in dollars per head is shown in figure 2.  The ESTLI premium has been creeping lower, and at the end of last week sat at $12.4/head.  Basically this means 20 kg cwt trade lambs were making just $12.4 more than 16kg cwt restocker lambs.

Generally a narrow spread between restocker and trade lambs is driven by abundant feed, as producers opt to hold lambs in favour of weight gain, forcing store buyers to pay more.  So the question is whether there is any money in buying lambs are current prices.

Figure 3 shows some rough numbers on buying lambs at current prices, and selling at our worst, expected and best case price scenarios.  Finishing on grass, and getting the current trade lamb price will provide a pretty good return, which is what buyers are banking on.

What does this mean?

Getting the current price of around 630¢ would be our best case scenario, as we think there will still be a flush of lambs, and lower prices in December.

Our expected price for December is 580¢, which is likely to be close to break-even after costs are taken out, while a loss will be made at last year’s December price of 520¢/kg cwt.  Obviously it is hard for those feeding lambs at the moment, with store lamb prices, grain prices and finished lamb prices not really stacking up unless prices continue to rise.

Just yesterday forward contracts were released for January ranging from 580¢ to 630¢.  If lambs can be carried that far on grass then a profitable outcome should be able to be locked in now.

Rain soaks up supply

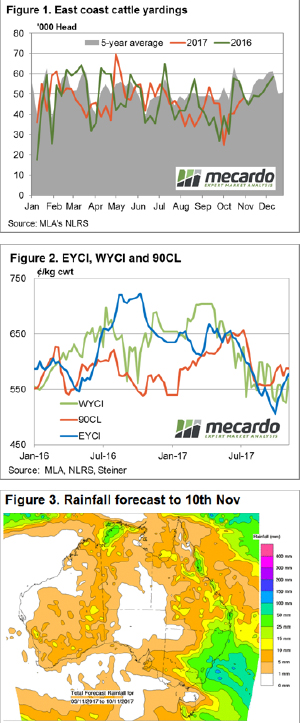
Most of the eastern states received rainfall this week and despite higher throughput young cattle prices continued to climb, with the benchmark Eastern Young Cattle Indicator (EYCI) closing up 1.8% to see it at 577.50¢/kg cwt this week.

The improved young cattle prices in addition to a 5.3% lift in cattle throughput along the East coast saw this week’s yarding figures back near longer term average levels at around the 48,000 head region – figure 1.

This is the highest weekly yarding figure reported in nearly two months which suggests demand is managing to keep up with the extra saleyard volumes. Indeed, since the start of October weekly East coast cattle yardings have lifted 93% and over the same time the EYCI has managed to gain around 8% – it’s amazing what a bit of rain can do.

The price jump not just limited to East coast young cattle with the WYCI lifting 7.9% on the week to see it reach 568¢/kg cwt. Eastern and Western young cattle prices beginning to converge toward the key beef export indicator with the 90CL frozen cow holding ground over the last month between 575-595¢kg CIF and currently sitting at 587.4¢ – figure 2.

The week ahead

The rainfall forecast for next week shows falls of up to 50mm across much of Eastern NSW, with lighter sprinklings across the rest of the Eastern and Western seaboard – figure 3. Anecdotal reports out of the US suggest the 90CL could see some further gains in the coming few weeks as competition between domestic demand on the back of Thanksgiving celebrations, and increased offshore buying (particularly out of Asia) make an impact.

The prospect of continued rainfall and a solid 90CL export price should continue to provide further support to cattle prices locally over the next few weeks.

It’s a great time to be a wool producer

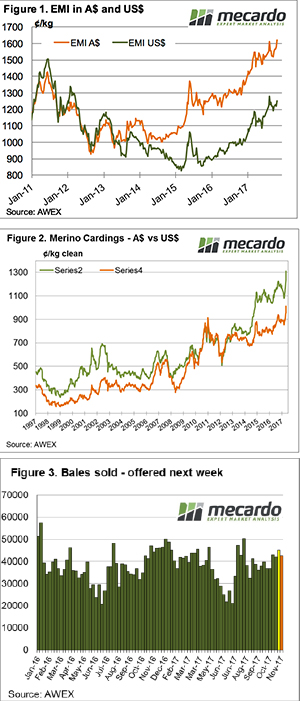
With one of the larger offerings for this year the market performed very strongly this week. Every category posted gains. Records were set with the 19.5 MPG posting its highest level since its 2001 listing, and cardings topping 1300 cents in Melbourne, a record against our records going back to 2002.

The Eastern Market Indicator (EMI) rose 45¢ on the week to 1,623¢ with AWEX reporting this a new record high in Australian dollar terms. The Australian dollar was unchanged on the week, with the EMI in US$ terms posting a rise also of 35¢ to end the week at 1,252¢. The EMI in US$ terms is edging however it is still well off its previous record of 1504 cents set in July 2011.

Only 2.2% of the offered bales were passed-in, resulting 45,193 bales cleared to the trade. Again, this is a strong signal of the strength of the current market.

Whether these prices are a result of AWI market initiatives, or a response to reduced supply, or maybe just a normal improvement in the demand cycle, growers who have wool to sell now are receiving “best ever” wool cheques.

The rally also carried across to the inferior types; as is usual in a strong rally, wool carrying higher mid-breaks, or lower tensile strength, or greater VM got carried along by the surging market.

We are now at levels where predictions of future price directions become a bit of a guessing game. Will buyers (more importantly their customer processors overseas) pull back from this rally and we see the market retrace, or is this rally unstoppable and further increases are imminent?

Either way, wool growers should continue to sell as soon as wool is tested, and also take a close scrutiny of forward price bids to look for cover for some production for future clips.

The week ahead

42,722 bales are rostered for sale next week across the three selling centres (Figure 3). The roster lists 44,000 and 40,000 for the following weeks; based on current demand this should pose little challenge for the market to absorb.

A look locally and globally

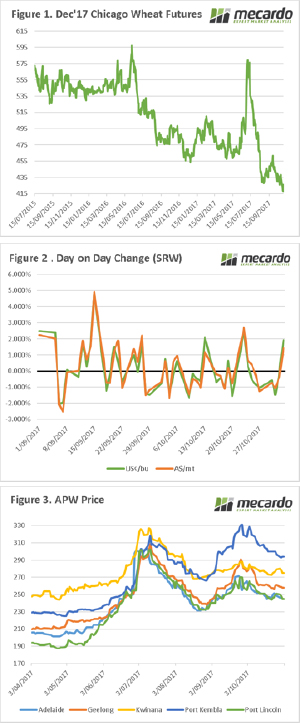
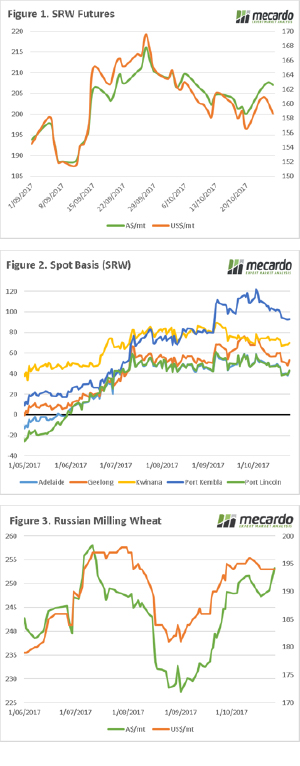
The market continues to follow a similar pattern to recent weeks. In this week’s comment, we look at futures & basis levels. In addition, we look at where our main competitor (Russia) is pricing its wheat. 

When it comes to wheat markets, we are in the dead zone. A time when there is a lack of fresh data to give the market a strong direction. In figure 1, Chicago wheat futures are displayed in both A$/mt & US$/mt. In A$ terms the Dec futures are up $7/mt week on week, however remain $1.7 down since the start of the month. The fall in the A$ against the US$ has helped balance against the fall in futures, so the fall has not been as strong (figure 1).

Throughout October, we have been warning readers that basis levels were unlikely to be maintained at levels seen at the start of the month. In the past week, basis levels have continued to fall (figure 2). This in combination with the low futures levels, reduces the overall price available to growers. The analysis article yesterday “Swap update” delves into more detail on using swaps to gain full advantage of the market.

The Russian crop keeps going from strength to strength, with estimates >82mmt. As we all know Russian/Ukraine are now our biggest competitors on the export market, and it is of paramount important to keep an eye on them. In figure 3, we can see that in A$ terms Russian wheat has increased strongly in the past month. This is helpful for Australian growers, as it makes our wheat compete more effectively.

Next week

At a local level, Australia is weeks away from the start of harvest and that is where our focus should lie.

It is important to ensure that you have a plan in place, for marketing your grain. At present grower selling is very low, and this could lead to a degree of harvest pressure on pricing.