Month: July 2019

Weekly Wool Forwards for week ending 12th July 2019

A quiet week in the forwards market with only three trades.

One trade was dealt in 20 micron wool for August and agreed at 2,000¢. Another trade was dealt in 21 micron wool for September and agreed at 1,975¢. The remaining trade was dealt for 28 micron wool, agreeing at 955¢ for December.

Forwards prices are playing yo-yo over the next 6 months or so, a reflection of the physical market of late. Uncertainty is creating market volatility, and it seems like no-one really knows where it’s going to end up. As the new auction season begins and we start to see volumes and quality presented, the forwards market should regain some composure.

WASDE, Burgundy & Dry outlook

The bulk of the world’s wheat crop is produced in the northern hemisphere, if something goes wrong there it can have a colossal impact upon pricing. Overnight the USDA released their July WASDE report. In this week’s comment, we will look at who the winners and losers were.

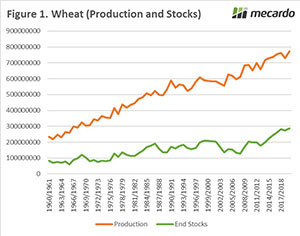
The overall picture for wheat is shown in figure 1. In the coming season production and stocks are expected to be at record highs. World production is however down 9.3mmt, and big chunks of the reduction are coming from export states.

  • Australia -1.5mmt
  • EU -2.5mmt
  • Russia -3.8mmt
  • Ukraine -1mmt
  • Canada -1.2mmt

This has resulted in the futures market posting solid gains overnight (A$7.80), which will likely flow through to local prices today.

In producing the WASDE report, the USDA have continued to use the acreage figures from the heavily disputed June acreage report (see here). As they will be resurveying the US producers over the coming month, it largely means that corn supply figures will be extremely dubious until the next USDA update. Although most traders and analysts will be making their own assumptions on the acreage planted to corn, there is still likely to be fireworks when more legitimate data is released.

Although anecdotal we received some promising crop news from our current EU correspondent. David Skipper, one of our trusted contacts and general manager of Tap Agri Co (Tasmanian Grain Handler) has sent us some reports back from his trip to France with the following comments:

I can confirm that the wheat, barley and canola crops are huge and in magnificent condition. The French (in the burgundy region) are now harvesting and crops are thick and heavy. I saw one wheat crop that had fallen over in some parts of the paddock.  I don’t think the French need to worry about crop yields this year. (Pictures)

The Bureau of Meteorology released their three-month outlook yesterday. It was quite bleak with drier than average conditions expected across much of the wheat belt. Long range weather forecasts at times have to be taken with a pinch of salt, however it remains concerning.

What does it mean/next week?:
The market in Australia is likely to see a rebound as it digests both the rise in overseas futures and the prospect of dry weather over the next three months.

ESTLI pushing through 900¢ again

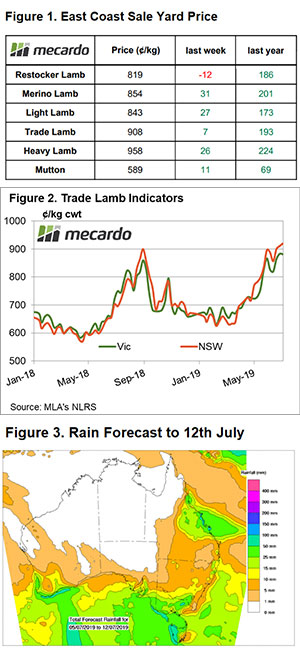
Just yesterday we released a piece on the prospect of a late Winter rally for the Eastern States Trade Lamb Indicator (ESTLI), signalling a test towards 935¢ this month. So far east coast markets are behaving compliantly, with the key lamb indicator finishing the week at 908¢/kg cwt.

Read the analysis on the Winter rally prospect here.

Despite the strong finish for the east coast Trade Lambs, they aren’t the most expensive category of lamb across the eastern states. Heavy Lambs rallied nearly 3% on the week to take the dearest lamb category prize at 958¢/kg cwt (Figure 1).

A breakdown of the state figures shows that NSW continues to drive the east coast prices higher, particularly for Trade and Heavy lambs with each category ending the week at 919¢ and 965¢, respectively. Compared to Victoria, NSW Trade Lamb is sitting 37¢ higher (Figure 2).

Delving further into the NSW figures, a wide price gap is appearing between these categories across the north and south of the state. This suggests that the dry conditions continuing to hamper the north are impacting on relative quality and volumes at the saleyard. Northern NSW Heavy Lambs are fetching 835¢ compared to 977¢ in the south of NSW, while Northern Trade Lambs are at 784¢ compared to 937¢ in the southern regions.

The National Mutton Indicator (NMI) managed to claw higher too this week, despite the best efforts of the WA mutton indicator acting as the deadweight to the national average. The NMI gained 1.2% to close at 585¢, while in the west mutton prices slid 13% to 416¢.

Seemingly the lack of live export buying interest in WA is hampering lamb and sheep markets over there, with all categories reported by MLA in decline this week. That is, except for WA Heavy Lamb which managed to creep up 6¢ to end at 842¢/kg cwt.

Next week?

There is more rain scheduled for Victoria and the south western tip of WA, but limited falls to SA and NSW again for the week ahead (Figure 3). As outlined in our analysis on the prospect of a late Winter rally, there is a chance for a final spurt higher towards the 935-950¢ level for the ESTLI during July, but there are signals we aren’t too far from peaking this season.

Rising slaughter no dampener on price

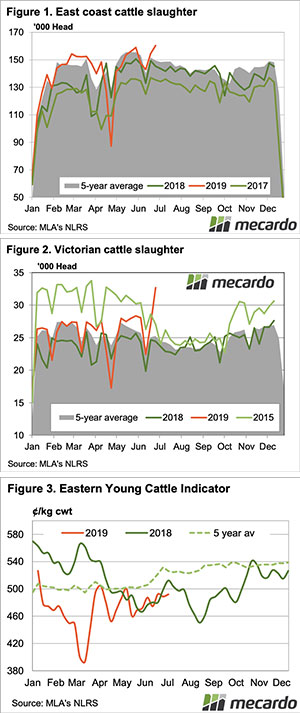
Just when you thought cattle slaughter might start to fall as we headed into the depths of winter, the stats prove you wrong. East coast cattle slaughter hit a new four year high last week, with Victoria showing some unusual strength.

East coast cattle slaughter usually declines after the June long weekend but this year it has done anything but. Last week’s east coast slaughter hit another four year high, gaining 3.7% on the previous week and 10% on last year (Figure 1).

In last weeks comment, we talked about Victorian slaughter running hot, and then it got even hotter.  Figure 2 shows Victorian cattle slaughter streaking higher again, setting a four year high of its own.  There were 34% more cattle killed in Victoria last week compared to last year, and this helped lift the east coast rate.

The higher slaughter doesn’t seem to be having a negative impact on price, likely due to strong processor margins. The Eastern Young Cattle Indicator (EYCI) was steady for the week (Figure 3), while most other state indicators remained largely steady.

One indicator which caught our eye was the Victorian Medium Cow, which finished the week at 233.5¢/kg lwt.  The Vic medium cow was up 20¢ on last week and 39¢ on last year. The stronger cattle supply in Victoria appears to be demand driven.

No doubt part of the reason for steady cattle prices in the face of stronger slaughter is export beef prices. The 90CL has gained ground in recent weeks in US terms, and with the appreciating AUD/USD exchange rate, the 90CL in our terms remains steady at the very strong 685¢/kg swt.

Next week?:

Victoria, South East SA and South West WA are set to receive more follow up rain in the coming week. These areas don’t grow grass very quickly at this time of year, but it will no doubt give hope for improved crops and hay yields this year. Spring growth also gets closer every week, and with it improved demand for store stock.

A sigh of relief for sale season opener

It was almost possible to hear the audible sigh of relief from buyers & sellers when the wool market began the official 2019/20 season with a “much welcomed positive result”. AWEX reported that after June posted the 2nd worst result in AWEX history (since ’95), the market ended in positive territory for the week.

The Eastern Market Indicator (EMI) fell back slightly on Wednesday but by the close on Thursday had found an 8 cent gain to end at 1723¢/kg clean. The Australian dollar pushed back up through US 70 cents for the first time since early May, quoted at US$0.704.

AWEX report that while the opening sale is generally large as producers clear stocks held across financial years, this offering was well down on previous seasons. In fact, the offering was down almost 13,000 bales or 29.4% compared to last year.

While the lower flock number and drought influence on fleece weights are factors in this reduced supply, the strong prices over the past season have encouraged wool growers to sell wool rather than store in brokers sheds. Not-with-standing the recent high pass-in rates, the market at present is operating on record low volumes.

30,991 bales were offered at Sydney, Melbourne & Fremantle, just 2,000 more than last week. The pass in rate across the selling centres pulled back significantly to 6.3% for the week (20% last week), with Fremantle sellers only passing-in 8% compared to last week’s +30%. This meant that 29,046 bales were cleared to the trade, almost 6,000 more than last week.

There is a somewhat absurd tone to this market, last week buyers pulled the EMI back 51 cents, growers passed in 20%, and just 23,332 bales were purchased by the trade. This week, EMI rallies 13 cents, Pass-In rate drops to 6% and 29,000 bales were purchased by exporters. This suggests that there is little strategy on behalf of either buyers or sellers, with a “short-term” approach dominating.

Crossbreds were the only section to not rise, holding last weeks levels, while Cardings in the eastern selling centres were stronger, however, the West was cheaper.

The week ahead

Next week a combined offering of almost 35,000 bales is rostered across all selling centres in the leadup to the winter recess.

A good lead indicator for demand into next week was the strong finish to the Fremantle sale, after posting a 16 cent rise on day one, it followed up with a further 19 cents on Thursday.

What does the wheat market and ice-hockey hacks have in common?

The wheat market has well and truly entered the volatile northern hemisphere weather market. It looked for a while like the wheat market was only moving in one direction. However, the past week has seen a retreat in pricing.

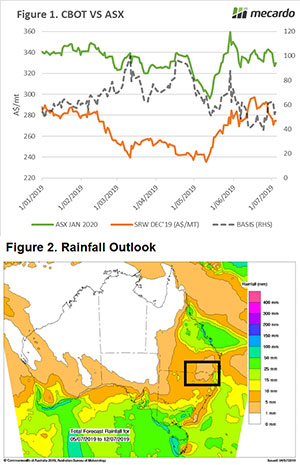
The wheat market and I have something in common. We both hit a wall and have broken down. My wall was whilst playing ice hockey (broken arm), the market’s wall was improving conditions. Since last Thursday, December CBOT wheat futures have declined A$17/mt, with ASX following the overseas market down (Figure 1). However, basis has somewhat strengthened (A$5), although this is likely to be tested in coming days.

The market fell this week when USDA reports showed corn planting figures higher than expected (see here). However, concerns related to the European crop were largely believed to be overstated. The overall EU wheat crop is expected to be up 10% year on year, with the major production regions of France and Germany being up year on year.

Dry conditions in the black sea have left production analysts confused with forecasts from 71mmt to >80mmt. The one certainty about Russian crop forecasts is the high level of uncertainty, they always tend to surprise.

At the start of June many parts of Australia (including most of WA) were missing out on rainfall, and it was looking very dicey. However, fortunes have turned around for many with substantial rainfall throughout the southern part of the country.  The forecast for the next 8 days is looking positive which will provide some additional confidence going forward.

The big area of concern is a rectangular area of NNSW and SQLD, which seems to be missing out on every forecast (see Figure 2). This is the third year in a row where winter crop conditions in this region have been poor. This is also an area where a large proportion of the domestic consumption of feed is located. In all likelihood, the season conditions will see large volumes moving from SNSW and VIC to meet demand.

What does it mean/next week?:
This is always my favourite time of the year for grain markets. The volatility is always up as new reports push the market back and forth. The July WASDE report will be released next week, which will give further insight into the global supply and demand picture.

If the corn crop hadn’t had its planting issues the wheat market would be substantially lower than at present. We will likely be in for a wild ride over the coming weeks.

The rain doesn’t stop corn planting?

In recent weeks the major discussion point in the grain market has been the difficulty in planting the US corn crop due to the torrent of rainfall. However, the market has suddenly lost steam over recent days. What is happening?

I have been asked a few times in recent weeks why the focus is on corn. Figure 1 shows the relationship between corn and wheat, which represents the returns or the weekly price change in percentage for both grains. As we can see, there is a high degree of correlation between them, which effectively means that if one goes up the other will follow (and vice versa).

This highlights the relevance of changes in corn supply and demand to wheat pricing. So why has the market suddenly fallen?

The USDA released their acreage report. This report provides an insight into the planted areas for each of the main commodities grown in the US. The biggest surprise, however, was that after all the reports of drenched paddocks and flooded rivers, corn was suddenly 3% higher year on year (Table 1).

The reason why is that the survey conducted for the acreage report was conducted in early June, at the mid-point of the monsoonal conditions. The figure also included the intended acreage from early June, which is now very unlikely to have been achieved.

The USDA has realized that the data is likely to require revision and are going to resurvey to update the figures for the crop report due to be released in August.

What does it mean?:

The algorithms which trade on data are likely to be a significant factor driving the fall in futures prices. Although on paper acreage has increased, it is highly likely that this data is erroneous and will be updated.

We may just be seeing a breather and when updated data is released there is the possibility of a rebound.

Key Points

  • Corn and wheat follow one another with a strong degree of correlation.
  • The acreage report shows an increase year on year to the area planted to corn.
  • This data is liable for major downward revisions.

Premiums for EU certified, are they worth the effort?

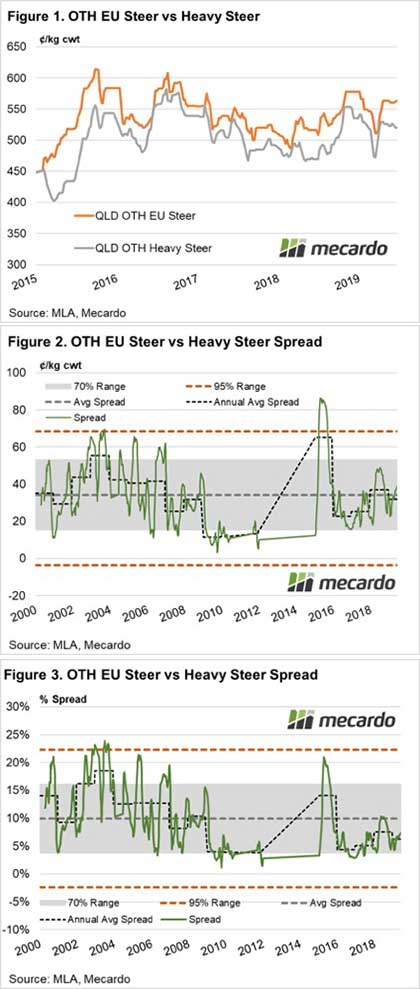
  • The EU certified spread premium has averaged 34¢/kg cwt over the last two decades, ranging from 15¢-53¢ for 70% of the time.
  • Rising cattle prices in recent years have seen the EU spread premium erode in percentage terms.
  • Since the middle of 2015, the EU certified percentage price spread premium has been unable to sustain levels above the long-term average, drifting along the lower end of the normal range.

A subscriber to Mecardo recently asked us to investigate the EU certified premiums available to producers that maintain their stock under the European Union Cattle Accreditation Scheme (EUCAS). Our subscriber was querying if there is a benefit to being EU accredited and if the premiums being achieved are worth the additional effort.

Certainly, the price behaviour of MLA reported over-the-hooks (OTH) EU steers to similar type OTH Heavy Steers in Queensland since 2015 shows that the EU steers usually obtain a premium, as outlined in Figure 1. Clearly an EU premium exists, but has it been expanding or narrowing over time?

In ¢/kg cwt terms the premium spread has averaged 34¢ over the last two decades, spending 70% of the time fluctuating between a premium of 15¢ and 53¢, as outlined by the grey shaded area on Figure 2. However, assessing the price spread in ¢/kg terms doesn’t consider higher underlying cattle prices that have occurred in recent years. To account for higher cattle prices, we should assess the historic spread pattern in percentage terms.

Analysis of the percentage price spread of EU certified Queensland OTH steers to Queensland OTH Heavy Steers for the last two decades shows that EU accredited stock have achieved a long-term average spread premium of 10%, with variations in the spread fluctuating between a 4%-16% premium for 70% of the time (Figure 3).

Furthermore, there have been times since 2000 that the spread premium has exceeded 20%, but these peaks have been far less frequent in recent years. Indeed, since the middle of 2015 the EU premium has spent most of the time at the lower end of the normal range, between a 4% to 8% premium. Currently, the EU premium for OTH EU steers versus OTH Heavy Steers in Queensland sits below the long-term average level at 8.3%.

Note: During the 2014/15 drought in Queensland OTH prices for EU certified steers ceased being reported so the spread was unable to be calculated during this timeframe.

What does it mean?

There are nearly 3,500 EU accredited farms and just over 50 EU accredited feedlots across Australia according the Department of Agriculture and Water Resources (DAWR) statistics. The DAWR website lists a range of requirements needed to be satisfied for producers to obtain and maintain EUCAS certified status.

It is claimed that cattle with EU certification attract a substantial price premium over non-EU accredited cattle of a similar type and this appears true when assessing the spread in ¢/kg cwt terms. However, spread premiums in ¢/kg terms have not kept pace with the underlying price of the cattle, so the spread in percentage terms has been eroded in recent times.

Dry continues to see prices trend sideways

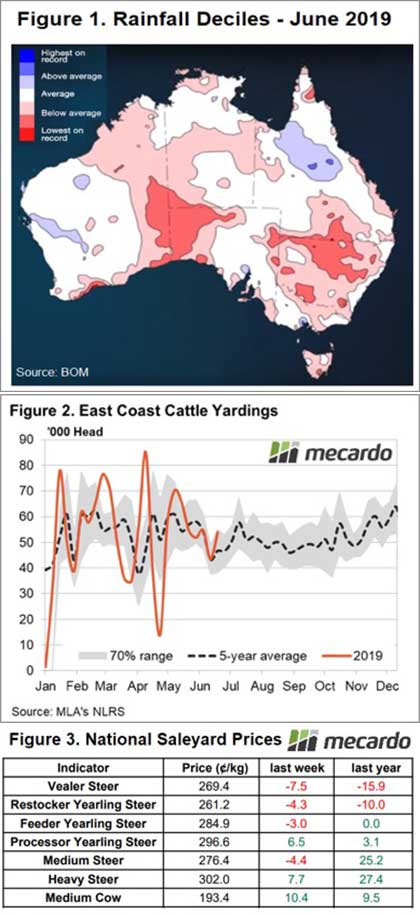
The Bureau of Meteorology (BOM) released their three-monthly rainfall outlook yesterday and it provided limited optimism for cattle prices to the end of Winter. The dry June across NSW and southern Queensland is not helping much either with elevated supply here keeping a lid on prices this week.

Being Western Victorian based we have received reasonably good rain so far this season, unfortunately for NSW, southern Queensland and the western half of South Australia the same cannot be said.

Figure 1 highlights the rainfall deciles for June and it shows large tracts of southern regions across the country suffering under below average rainfall. The prospect isn’t likely to improve as we head toward Spring according to the most recent BOM three month rainfall outlook with drier than average expected for much of the East coast and the southwestern half of WA.

The dry times are keeping East coast cattle yarding levels elevated (Figure 2) and a breakdown across the eastern states shows that it is NSW and Queensland that are contributing most to the higher throughput figures of late.

East coast yardings are trending 15% above the long-term average for this time in the season, this is despite Victorian numbers running below their average trend by 3%. The culprits for the higher East coast throughput levels are NSW and Queensland with yarding levels running 36% and 10% above average, respectively.

The Eastern Young Cattle Indicator (EYCI) reflected the higher east coast supply easing 3.5¢ to close at 488.75¢/kg cwt. Most National cattle price indicators mirrored the EYCI posting declines between 3.0¢ to 7.5¢.

However, processor buyers remaining active chasing the limited stock available to see Processor Yearling Steers, Heavy Steers and Medium Cow lift – Figure 3.

Next week

Reasonable rainfall is expected this week for Victoria and the southwestern coastal tip of WA, but limited falls are slated for the rest of the country. As outlined a few weeks ago, offshore export prices remain firm and this is keeping processor margins running strong, so they will continue to support the market on dips.

However, the extended dry across NSW and Queensland is limiting the opportunity for cattle prices to extend higher. This spells more price consolidation and sideways movement for the short term.

ESTLI hits 900¢ but mutton has halted

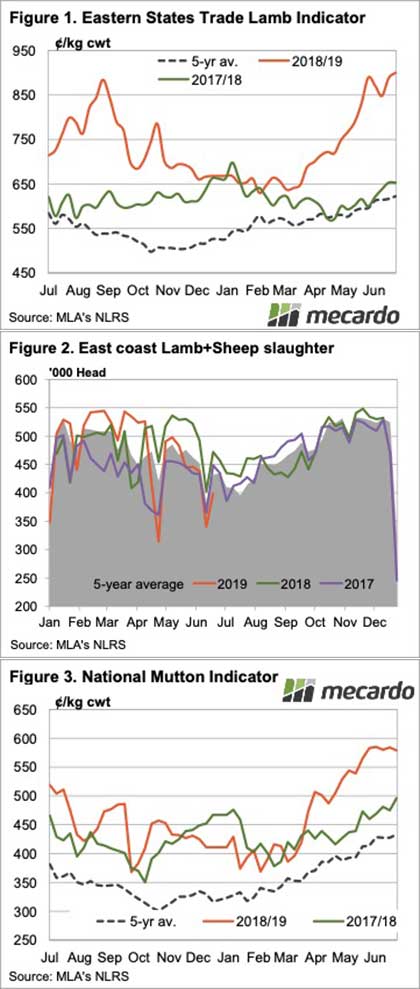
The lamb rally continued this week, as supplies continued to tighten.  The Eastern States Trade Lamb Indicator (ESTLI) set a new record, just hitting 900¢.  Mutton markets might have hit their peak, however, having come off in recent weeks.

After a brief dip there a few weeks back, which could have been in anticipation of a short week, the ESTLI price rally has made its way to 900¢/kg cwt.  The ESTLI was up 15¢ this week, and interestingly, just 12¢ higher than four weeks ago.  Current levels look like they are providing some resistance.

Tightening supplies are no doubt sending prices higher.  Over the last two years there have been periods where lamb supplies have been tight, and sheep have been tight.  It has been almost exactly two months since ovine slaughter has hit this level in a full week (figure 2).

Last week total sheep and lamb slaughter was 15% lower than last year, and 7.6% below the five year average.  It didn’t get this low at all during the price peaks last year, and it is still only June.

Figure 3 shows the National Mutton Indicator seems to have found its peak.  Sheep supply is tight, but is around the five year average, and it looks like processors are finished bidding up prices to try and draw out supply.

Mutton prices generally trend down in July, but it will be hard for that to happen again this year, as surely supply will remain tight for a while yet.

What does it mean/next week?:

For sheep and lamb prices to fall, either demand will have to weaken, or supply improve.  Traditionally lamb and sheep supply will fall for another couple of weeks, before starting to recover.  Last year the lamb supply didn’t come until August, so we may have a while to wait before we see prices ease.