Month: July 2019

Some normal seasonality returning

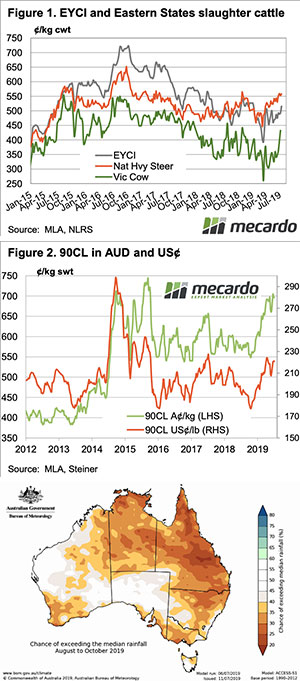
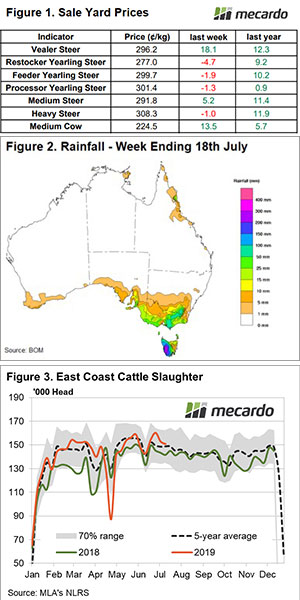
There has been more rain in the far south and nothing to speak of in the north, yet the Eastern Young Cattle Indicator (EYCI) continues to climb.  This week we saw the EYCI hit a new 2019 high, and tip just past the five-year average.

The south is definitely helping to push the market, with Wagga the most expensive in the EYCI this week at 615.75¢/kg cwt. Although Dubbo did bolster the numbers, with 12% of the market, at 582¢.  As with most weeks, the Roma store was the biggest market, making up 18.6% of the EYCI, but we couldn’t find the price.

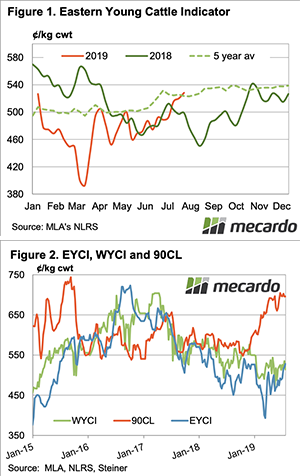
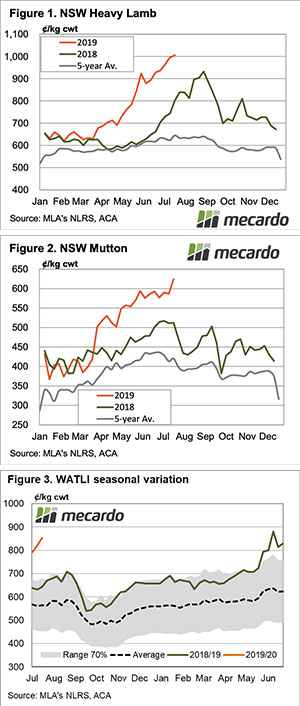
It has been over seven months since the EYCI was above 525¢, with early November being the last time. Despite the continued dry, the EYCI seems to be following more of a ‘normal’ seasonal trend.  This involves rising in winter as supply tightens and demand improves.

The improvement in demand is coming from southern growers, who are becoming more confident of spring growth and some replenishing of fodder supplies. We have been harping on lately about the high slaughter rates in Victoria, so perhaps some demand is coming from those looking to restock.

Over in the west, the Western Young Cattle Indicator (WYCI) slid lower this week.  At 514¢, the WYCI is now below the EYCI for the first time in 18 months (Figure 2). Both the EYCI and WYCI have plenty of upside potential, with the 90CL remaining steady at close to 700¢.

Next week?:

Southern areas of WA, SA and Victoria are forecast to receive more showers next week and this should keep demand in those areas strong. The lack of rain in NSW and Queensland will keep a lid on any price rises. 

Record breaking heat in Europe

In this week’s comment we take a look at local pricing and the current environment in Europe. Will the weather help or hinder the crop?

The futures market has largely been bereft of data to drive it during the past week and has largely traded in a narrow band. December Chicago futures are down A$3 since last Friday and A$28 from recent peaks.

On a global level the International Grain Council have revised their forecasts for the coming season. Global production is down month on month by 6mmt, with consumption also being revised downward by 3mmt. Overall stocks were brought down to 270mmt, which remains joint record with 2017/18.

At a local level, old crop pricing has come under some pressure (figure 1). As we move closer to harvest, I can foresee two potential scenarios:

  1. The price declines will continue until the new crop harvest or until they converge with new crop pricing.
  2. If there are any delays to harvest, old crop will rally as hand to mouth consumers chase what little is left.

Europe has experienced some extremely hot weather with records being broken across the continent. The wheat/barley crop is unlikely to be massively impacted as they are harvesting, however corn remains the biggest risk. The hot weather could ultimately lead to downgrades to yield. In a similar fashion to the US corn/wheat story there could be a flow on effect on wheat pricing.

Remember to listen to our podcast 

What does it mean/next week:

Analysts are currently looking at the Russian wheat crop, with the consensus being that a good crop will be produced but not a record worthy one. Interestingly it is looking like Ukraine are on track to produce a record crop.

Sideways – not just a movie about sad old men

The Eastern Young Cattle Indicator (EYCI) managed to eke out a limited gain this week, lifting 4.45¢ to close at 520¢/kg cwt. Limited rainfall across much of the nation, except Victoria, acted as a headwind. Meanwhile, tightening supply across the east coast stopped the market from tanking too much.

National sale yard cattle indicators for the week were somewhat mixed, albeit within a narrow range with the opposing forces of limited rain and reduced supply keeping markets in a broad sideways pattern.

Yearling and Heavy Steers were marginally softer, coming in 1¢-5¢ lower across the nation. Vealer and Medium Steers, along with Medium Cow managed a little better with gains between 5¢-18¢ noted – Figure 1*. The National Vealer Steer indicator was given a significant boost this week by a large jump in WA Vealer Steer prices, up nearly 92¢ to close at 309.2¢/kg lwt.

It probably comes as no surprise given the rainfall pattern this week (Figure 2) but cattle prices in Victorian sale yards showed the most vigour across the states with gains between 8¢-23¢ noted for all reported categories, except Victorian Vealer Steers.

Looking at the east coast slaughter trend in recent week we have seen levels begin to trend lower since the start of July – Figure 3. A few weeks back we were processing around 160,000 head a week across the east coast, currently we are running at around 150,000 head and its likely in a few weeks’ time numbers will ease toward the 140,000 head region. That’s if the market follows along roughly with the average seasonal trend (black dotted line on Figure 3).

* All cattle prices in Figure 1 are expressed in ¢/kg lwt terms

Next week

The rainfall forecast for the coming week shows a repeat of this week, with falls limited to Victoria, coastal SA and the south west tip of WA. Limited rainfall on the horizon and the prospect of a dry finish to winter and a dry start to spring won’t do a lot to get cattle prices moving aggressively higher.

Seems like it’s a continuation of the sideways moves for the near term. If you are getting bored watching the sideways moves of the cattle market check out the 2004 comedy/drama Sideways over the weekend – its worth a laugh or two.

We’ve got an indicator at $10

Lamb supply continues to contract and with it, prices are on the rise, mostly.  There were a couple of negative spots, especially in the restocker department, but we did see an indicator break through the extraordinary 1000¢ level.

New South Wales was where the action was at. The NSW Heavy Lamb Indicator was the first to break through the $10 mark.  NSW Heavy Lambs gained 28¢ this week to hit 1005¢/kg cwt (Figure 1).  Last year the peak in prices saw NSW Heavy Lambs leading the charge as well, no doubt dry times makes them hard to produce and in short supply.

It is especially hard to carry heavy lambs through when prices have been at record levels for more than a month.

Mutton also broke through resistance this week.  NSW (Figure 2) and Victorian Mutton Indicators both moved through 600¢, posting 624 and 620¢/kg cwt respectively. This time last year Mutton prices were falling, but the lack of stock left and the better season are now driving prices to new highs.

There were losers this week despite the records.  Restocker lambs eased back to the 800-820¢ range. Old season lamb demand is waning as the risk of cutting teeth increases, while no one seems to be selling restocker suckers in the saleyards.

On Auctionsplus restocker suckers are making more than $10. There was one lot of first cross ewe lambs which made $20/kg cwt. They were very light, but $150/hd for a 20kg lwt lamb is extraordinary.

Things are good in the West, but not as good as the east. The WATLI gained 31¢ to 853¢/kg cwt (Figure 3) and is not far off the record high set in June. WA Mutton did hit a record however, rising 34¢ to 518¢/kg cwt.

Next week?:

The coming month will be intriguing for lamb and sheep markets. A lot will depend on how quickly new season lamb producers can get weight into lambs and get them to market. There can’t be many old season lambs left.

Rollercoasters also go down.

In the past week A$18 has been lost from the December CBOT wheat futures, back to mid-May levels.

Figure 1 outlines the movements of the wheat market since the start of the season. The reasons for the recent falls are as follows:

  • Harvest has commenced in parts of the US. This has prompted a fast pace of selling by producers, and the extra supplies has pushed down the bids offered by buyers. This is a similar pattern that we see in Australia during harvest.
  • Many parts of the US still in the growing phase are set to receive beneficial weather over the coming weeks.
  • US export sales remain poor as other origins come on stream. This has pressured the US market to fall in order to remain competitive.

In recent weeks the ASX market has fallen, and it would be expected that the large fall overnight will see pressure on local bids. At present ASX-CBOT basis for the harvest period is at the highest level since the start of July (+A$60).

This period of the year is always one of great volatility, with this year being no exception. In recent years there has been a rally during midyear followed closely by a crash (Figure 2). This year has probably been the most bullish environment, however the question remains whether there will be a rebound after recent falls or whether the pattern of recent years will continue.

In other news, rumours abound of very slow payments being made by a grain trader. At present these are just rumours, so no names cannot be given due to the potential legal ramifications. However, I advise that you read this article I produced around the time of the Lempriere Grain collapse.

As an extra piece of advice. Do not accept any excuses/promises if you are well overdue on receiving payment.

What does it mean/next week?:
The trade is still waiting for fresh data to determine what the corn acreage is likely to be. I have a feeling that most will have made their assumptions and when the data comes out the speculators will likely provide a short boost, but it may be short lived.

There are decent weather forecasts for the southern growing region over the next fortnight. As seems to be the case the norther regions in NSW & QLD seem to be missing out again.

The market skew

In this analysis we look at the overall Chicago wheat each year since 1973 to examine the skewness of the market. This provides an indication of how far the market trades from the normal distribution and provide some insight into where prices have historically been.

In this article, we are going to look at the ‘skewness’ of the wheat market over an extended period of time.  To start with, it is important to define what we mean by skewness. Many of you will be aware of the normal distribution or bell curve (Figure 1). The bell curve describes a symmetrical data distribution where the results will be 50% below or above the peak, with most (or 68%) being close to the mean.

The skewness of a distribution curve represents the degree of distortion (or lean) from the normal distribution. The bell curve example (Figure 1) represents a dataset with no skew. The lean can be either positive or negative, depending upon whether the tail of the data is to the left or right.

There are some examples of skewness based on individual years in Figure 2 (animated). In 1984, the pricing of wheat followed very closely to a normal distribution, with most daily prices within 1 standard deviation of the mean. In 1976, there was a strong negative distribution with prices heavily skewed above the mean and in 2017 the lean was positive with prices skewed lower.

In Figure 3, I have calculated the annual skewness on the daily spot price for Chicago wheat futures from 1973 to present. Prices have overwhelmingly been skewed towards the positive. There have only been eleven years when the skew has been negative and seven of those years have been prior to 1990. This means that in most years since 1973, the daily price has been skewed lower.

What does it mean/next week?:

On an annual basis, the Chicago wheat contract has spent most years with a positive skew. This means that prices have trended lower than the mean.

This could point towards the importance of growers hedging when prices are strong. As the market tends to trade with positive skewness, we would expect prices to trend lower than the mean.

Key Points

  • Skewness represents the ‘lean’ from the normal distribution.
  • Positive skewness in wheat pricing shows that the distribution leans to the lower side of the normal distribution, and vice versa for negative skewness.
  • There have only been eleven negative price skews since 1973 (including the current year).

Is the market right for a forward contract?

It is important to keep an eye on the market for pricing opportunities, especially beyond the current season.

In the past few years, there have been excellent opportunities at this point of the year to lock in strong futures levels, especially offshore. How does it stack up for producers at the moment?

Firstly, let’s look at CBOT wheat. After a strong rally the market has stalled whilst awaiting new data. At present that market is not yet at the highs of last year, but with corn acreage likely to be radically altered in the coming weeks. This makes an opportune time to start putting together a strategy for pricing.

At present the Chicago wheat market is in contango (Figure 1), which means that forward months of the market are at a premium to the spot (present) market. The December wheat contract is currently trading at A$273/mt. Taking out a futures contract (or swap) at this level will protect you from any downside in the futures market, whilst still retaining any exposure to basis. We expect that basis will remain quite strong this year in many parts of the country due to an average crop coming off the back of a poor crop.

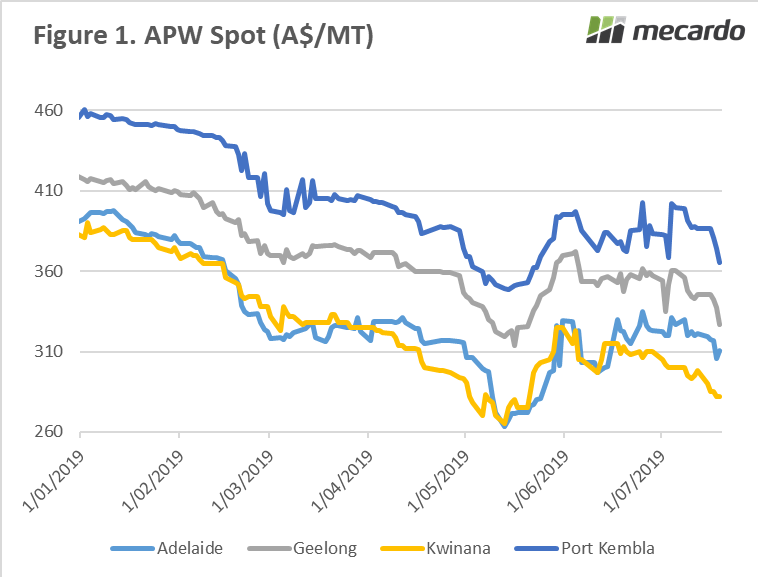
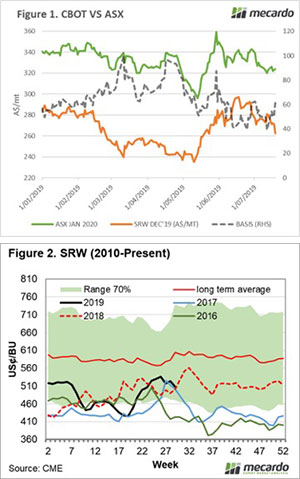
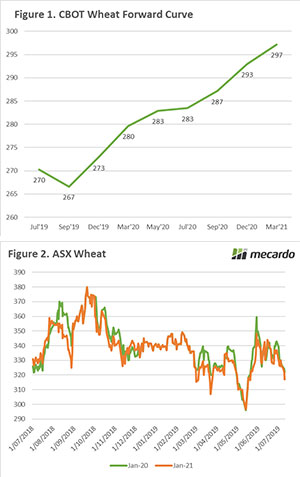
However, when we look further out to next December (2020), we can see that the futures contract is trading at A$293/mt. This may be a more attractive proposition when using CBOT futures as it provides a level which will most likely end with an overall price well above A$300/mt when basis is added.

CBOT is a good tool for using, but there are also the ASX futures, which have been gaining more volume in recent times – as drought has bit. The ASX contract has fallen in recent weeks as local conditions improve and consumers step back from the market.

The contracts for both Jan 2020 and Jan 2021 (figure 2) are both trading at similar levels of A$322 and A$317 respectively. A far cry from last September when our advice was to lock in contracts at A$370-380. However, this does still provide levels which are reasonably attractive.

What does it mean/next week?:

Price risk management is not about hitting the top of the market, it is about locking in a level or protecting yourself from adverse movements.

I tend to advocate a small bite size approach, where you take small positions in the market when it is attractive. This will protect you from downside whilst still providing some opportunity to participate in any upside.

Key Points

  • Chicago wheat futures are offering A$273 for this December and A$293 for the following.
  • ASX wheat futures are offering A$322 for this January and A$317 for the following.

Lamb rally not done yet

Remember last year when lamb prices moved through 800¢ and we thought it couldn’t go much further?  We have had a case of Déjà vu this year, although prices were 100¢ higher, and this week have continued to rally.

Lamb prices didn’t just creep higher either, the Eastern States Trade Lamb Indicator (ESTLI) rallied 37¢ to hit a new record of 945¢/kg cwt on Thursday. The ESTLI still hasn’t managed to catch the East Coast Heavy Lamb Indicator, but it did make up some ground. The Heavy Lamb Indicator gained 15¢, and also hit a record of 973¢/kg cwt.

Over in the west, the lamb price rally has stalled and has come back to 800¢. Being a predominately export market this gives us some idea of what export lamb processors would like to be paying.

Figure 2 shows it is likely to be some time before prices are able to be pulled back if last year’s supply trend is anything to go by. All the anecdotal evidence suggests the new season lambs are nearly a month behind normal, and there are likely to be fewer than last year. The supply dearth might last until September again.

Last year the dry winter saw processors killing a lot of sheep, replacing lambs on the chains. This year sheep will be hard to find as well. While the mutton price rally has stalled, it is feasible they could still be around 600¢ in mid spring.

Next week:

Can the lamb rally continue further? Forward contracts released this week offer a pretty good target of 1000¢/kg cwt, but can old season lambs reach this level?  If lamb supply gets as tight as last year and more sheep come to the fore, we could feasibly see the ESTLI at the magic $10 mark. 

Season high for EYCI

The Eastern Young Cattle Indicator (EYCI) is finally having a go at its winter rally. Seasonal conditions are on the improve in the south and it appears restockers might have decided it is time to take on some risk.

The rain was concentrated in southern areas again this week, with WA, Victoria and South East SA all receiving what could be considered normal winter falls. Parts of Queensland and NSW also got some rain, but it was a long way from drought breaking.

The improving season in the south appears to have given the market some impetus. The EYCI rallied 23.5¢ for the week to hit a 2019 high of 515.5¢/kg cwt (Figure 1). The price increase didn’t extend to finished cattle, with the Heavy Steer Indicator sitting well above its young cattle counterpart.

Cow prices have responded to the wet weather, however. The National Medium Cow Indicator has gained 85¢, or 29% in three weeks, also hitting a 2019 high of 435¢/kg cwt.  Not surprisingly Victorian Cows are leading the charge (Figure 1), sitting this week at 478¢/kg cwt, but not quite as expensive as in Tasmania, where they are 497¢.

We knew cow prices had some room to move higher. Figure 2 shows the Frozen Cow 90CL export price remains close to 700¢ in our terms.  Competition between China and the US for our lean trim remains strong and is keeping a floor under prices.

Cattle slaughter has dipped lower in recent weeks.  While it is coming off a four year high, tightening supply while export prices are good will lead to higher values at the saleyard.

Next week:

The latest Bureau of Meteorology (BOM) three-month outlook, released yesterday, doesn’t offer a lot of hope for a wetter than normal spring (Figure 3). Whether you believe the BOM forecasts or not, the forecast isn’t great for store cattle prices, but does suggest finished cattle will be hard to come by for some time yet.

Buyers complete order before winter recess

The wool market is now taking the Winter recess over the next three weeks. Buyers were active as they completed delivery orders, lifting the market into a positive finish. Generally, a 10 to 40 cent lift across the individual MPG’s was observed, with the Sydney & Fremantle markets seemingly the strongest.

The Eastern Market Indicator (EMI) was slightly higher on Wednesday but by the close on Thursday had found a 31 cent gain for the week to end at 1754¢/kg clean. The Australian dollar eased again to below US 70 cents closing at US$0.696 on Thursday. This resulted in the EMI in US$ terms to increase by 9 cents to end at 1,222.

The wool market opened at historically high levels in August last year, peaked in September before finding its low point at the end of the season. The EMI opened at 1990, rallied strongly into September to find a peak of 2094, before closing at 1754 this week, close to the low for the season of 1723. Across the season a fall of 11.5%.

In US$ terms, there was a similar patter, with the difference compared to the start of the season a decline of 16.4%.

34,080 bales were offered at Sydney, Melbourne & Fremantle, almost 3,000 more than last week. The pass in rate across the selling centres remained at 6.3% for the week. This meant that 31,923 bales were cleared to the trade, almost 3,000 more than last week.

In the season just completed, the drought impact was felt both in the average merino micron which for July was 18.5 microns, down 0.4 on July 2018. Also impacted was the volume of wool offered for the season. On a monthly average 32,875 bales were cleared to the trade, compared to 39,253 for last season. This represented a 16.5% decline in the total number of bales sold at auction compared to last season.

Crossbreds were amongst the strongest performers across the season, with the 30 MPG up 177 cents or 26%, while Cardings were in severe decline across the season finishing 32% lower.

This week however, the rising tide lifted all boats, Crossbreds were marginally dearer with Cardings also up and quoted in Melbourne improving 50 cents or 5.4%.

The week ahead

We now begin a three-week break. Exporters will take this opportunity to visit customers in the northern hemisphere and look to secure orders for the coming season.

The conversations will revolve around demand from retailers, and projected supply from wool producers, looking to find the match for the opening sales.

We have had reports that retail demand is soft, and we know that supply is at record low levels. Just which factor drives the opening sales is not clear making for another interesting wool market opening.