Month: October 2019

Uncharacteristic lift in NSW throughput weighs on price

Significant increases to yarding levels for both lamb and sheep across the eastern states in recent weeks has started to weigh on prices. Higher than average lamb yarding was noted in Victoria but the big lift in lamb throughput was reserved for NSW. Mutton yarding levels were elevated in all east coast states.

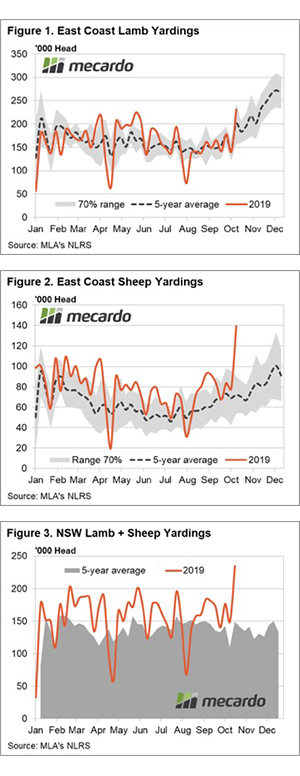
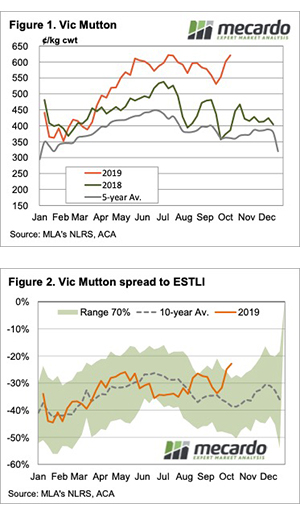
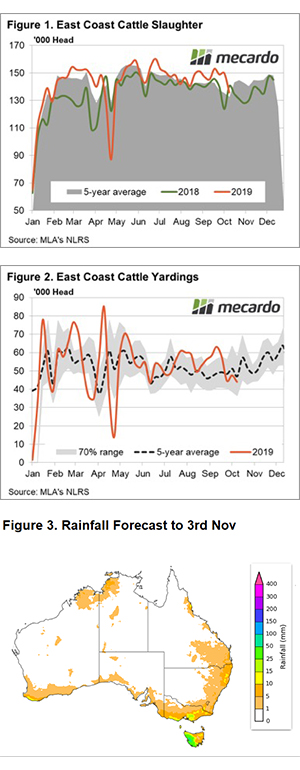
Weekly east coast lamb yardings levels hit a seasonal high last week at 231,591 head representing a 64% jump on the week prior. This places lamb yarding levels 16% above the five-year seasonal trend for this time in the year (Figure 1).

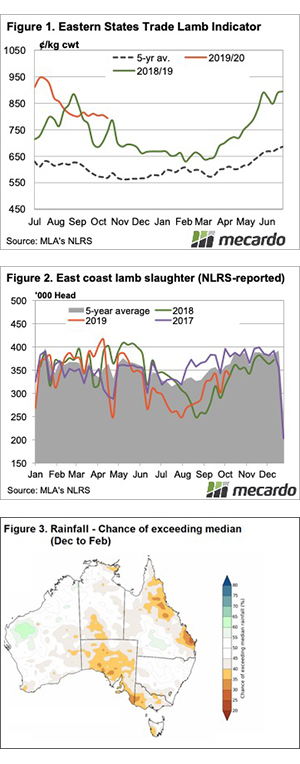
Lamb throughput in Victoria is trekking 9% ahead of the seasonal average but underpinning the jump in east coast lamb volumes at the saleyard has been NSW flows. Lamb yarding for NSW last week was up 48% on the week prior and is sitting 31% higher than the five-year average trend at 142,305 head.

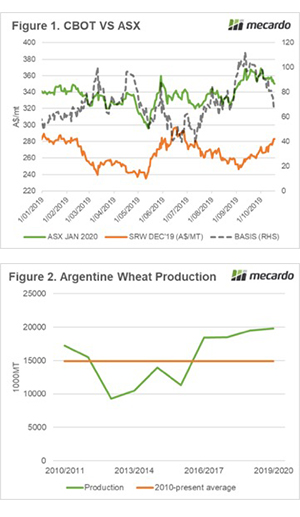
Increased throughput wasn’t reserved for lambs alone with mutton numbers swelling too. Weekly east coast sheep volumes at the saleyard up 79% on the previous week to hit a seasonal high at 139,169 head. At this level east coast sheep yardings are sitting at massive 94% above the five-year seasonal average and you would have to go back to 2006 to find a higher weekly east coast sheep throughput level (Figure 2).

Higher than average sheep yardings were noted across all east coast mainland states with SA 42% above the five-year level, Victoria 51% higher and NSW, again underpinning the broader east coast figures, with sheep yarding levels 135% higher than the seasonal trend for this time in the year. Figure 3 shows the combined lamb and sheep throughput for NSW and it demonstrates how unusual this increase in saleyard volume is.

The National Trade Lamb Indicator (NTLI) feeling the brunt of the increased supply easing 4.2% this week to close at 770¢/kg cwt yesterday. Unsurprisingly, NSW Trade Lambs were lower too, slumping 4.8% to finish at 783¢/kg cwt. The National Mutton Indicator (NMI) eased 2.1% this week to 555¢/kg cwt. NSW mutton prices holding up well considering the elevated supply in recent times, dipping just 2.2% to close at 577¢/kg cwt.

Next week

The Victorian spring flush is underway but the significant numbers we see into November are yet to come. There is some rain forecast for Victoria this week which will allow producers to hold lambs for a bit longer if they are keen. Prices favour a downside bias until some of the Victorian supply is able to be accounted for.

Another week, another rise in export prices

The Aussie dollar was higher thanks to improving prospects for China/US trade, and declining chances of an interest rate cut next week. This had little impact on export prices however, with higher US value-driving export prices higher.

The story is the same, Chinese demand is diverting product away from the US and importers are scrambling for available lean manufacturing beef. Our slaughter rates remain relatively high, but the Chinese seemingly have more money than the US at the moment.

Figure 1 shows that the 90CL Frozen Cow indicator has rallied with only a couple of hiccups for the last 11 months. Needless to say, current prices are at record levels. Figure 1 also shows how far behind the Eastern and Western Young Cattle Indicators are.

This time last year local young cattle prices were at a small discount to the 90CL, now export prices are the only thing holding young cattle prices at reasonable levels.

Cattle price moves were rather benign this week. Slaughter cattle remain very well priced. The most expensive indicators in the country were the Queensland and Victorian Heavy Steer, at 568¢/kg cwt.

The Queensland Heavy Steer premium to the EYCI has fallen from 20% to 15% (Figure 2), and it’s well above the same time last year. With export beef in demand and young cattle not so much, this isn’t a surprise.

Next week

With no real rainfall on the forecast, we can expect more of the same for the coming week. For markets to go lower, either export markets need to fall, or cattle supply increase. At this stage it’s hard to see either of these things happening, so we continue to wait for rain for the upside.

How volatile are wool prices?

As humans, we outweigh the reaction to losses more than the benefit of gains. So, it pays to look at longer-term data to test this emotional reaction, seeing whether it is grounded in reality or simply an emotional response. This article takes a look at the size of cyclical downturns in Merino wool, beef and wheat during the past two decades to put the recent fall in wool prices in a less emotional context.

The average Merino micron price is down AUD700 cents on mid-2018 levels. Peter Small, writing in Sheep Central recently, described a young wool grower asking about price stabilisation as an answer to recent falls in the wool price (view here). The question implied that the fall in wool prices during the past year has been unusual, but is it?

Figure 1 shows the monthly average for the average Merino micron price from 1996 to last month. It nearly touched 2500 cents in mid-2018, and is now around 1800 cents. It has certainly been a big fall in price, from a high level. Also shown in Figure 1 is the change in price from the highest price level of the previous five years. The idea is to look at the depth of the down cycles in terms of the proportion that prices fall from the peak to the trough (P to T). In the late 1990s, when many apparel fibre prices were depressed, the Merino price fell from 1997 peak levels by around 45%. It fell a similar proportion in 2005, down from the 2002-2003 peak. In 2009, the price only fell by 30-35%. In 2012 through 2015 the price fell from the 2011 peak by a more modest (again) 30%.

Currently, the market is 27% below 2018 peak levels, roughly on par with the 2012 downturn. The current downturn is therefore (so far) moderate and similar to the previous down cycle. The down cycles have become less severe in the past two decades, which makes sense as the level of stocks and production have fallen.

How does wool compare to beef? Figure 2 repeats the exercise for a NSW saleyard trade steer price. Since the 1990s down cycles have resulted in a fall of 25-30% from prior peak levels. The 2014 down cycle was appreciably smaller at around 20%.

Figure 3 treats a NSW wheat price series (Newcastle zone) in the same manner. Wheat shows up as more volatile, with some hefty down cycles where prices fell by 50%. There have been a couple of down cycles in the order of 30%, as well.

The take-home message from this very brief look at price volatility is that the average Merino wool price has comparable price volatility to beef and wheat. Down cycles do vary, but it is hard to make a case for the Merino price being in a league of its own in terms of price volatility.

What does this mean?

The average Merino price has fallen by around 700 cents since mid-2018. For those of us anchored in the 1990s that is a frightening number as it was once a (successfully) hedgeable price in its own right for 21 micron. In proportional terms though, the current downturn in wool prices looks to be playing out to it standard of the past decade. In comparison to trade steer and wheat, the wool market is not overly volatile – just a commodity price which goes through patches of strength and weakness.

Rising Tide lifts all boats

It was a steady and solid opening to wool sales this week, which offered a welcome respite to buyers and sellers alike from the recent wild roller coaster ride for wool prices over the past month. With lifts in price across the board, the pass-in rate retreated to single-digit figures.

This rising sentiment continued to the close of selling, with AWEX late on Thursday reporting Fremantle market “strengthening all the way to the final hammer.”

The Eastern Market Indicator (EMI) gained 28 cents (after losing 26 cents last week), to close at 1545 cents. The Au$ also rose to US $0.684, and resulted in the EMI in US$ also rising 28 cents to settle at 1,058 cents. The WMI had a strong week benefiting from selling last, rising 51 cents to 1672.

The market improvement was general and across the board. Gains of 1.5 to 2.4% were reflected across the range of MPG categories, a case of a “rising tide lifting all boats”.

A look at the relative centre offerings shows that with Sydney only selling on day 1, it only offered 4,972 bales to sell 4,577, while Melbourne over 2 days sold 14,627 out of the 15,498 bales that came forward. Fremantle passed in 8.3% of the 6,607 bales offered, for a clearance of 6,057.

There was a much-reduced offering of 29,760 bales this week, almost 6,000 bales fewer than last week’s volumes. The National Pass-in (PI) rate was half of last week at 7.1%, which meant 27,641 bales were cleared to the trade, 2,548 less than last week. The supply shortfall is still significant, with 113,600 fewer bales sold so far this season compared to the same period last year. This equates to an average weekly gap of 8,114 bales since July.

The dollar value for the week was $48.93 million, and a bale average value $1,770. The combined value so far this season of $614.50 million.

Crossbreds performed in line with the general market, while Cardings were quoted up 3%, however it was only Melbourne & Fremantle centres that contributed to the rise.

The week ahead

All centres return to selling both Wednesday and Thursday next week, with an increased offering of 39,000, 10,000 more than this week.

Despite the increased offering, the positive end to sales this week should provide a solid platform for next week.

A little give and take

The shaky wool market opened this week lacking power. With a decent offering, the first day of sale saw instant corrections across the board, only to show signs of a resurgence at the days’ end.  This momentum carried through to a stronger market on Thursday, however it wasn’t enough for the market indicators to avoid overall declines on the week.

The Eastern Market Indicator (EMI) lost 26cents (after gaining 32 cents last week), to close at 1517cents. The Au$ also rose to US $0.678. This buffered some of the fall in the EMI in US$, dropping 12 cents to end the week at 1,030 cents.

The Fremantle sales proved weaker than its eastern counterparts on day one, falling 42 cents before regaining some ground on the second day of sale. The Western Market Indicator lost 32 cents on the week to close at 1,621 cents. AWEX reported that despite the price rises on day two, there were still many unwilling sellers, resulting in nearly 20% of the fleece passed in.

There was a much higher offering of 35,356 bales this week, an extra 7,207 bales on last week’s volumes. The National Pass-in (PI) rate was 14.6%, which meant 30,189 bales were cleared to the trade. This is the first week since March that we have seen the number of bales sold actually higher than the corresponding week last season. Of course, the supply shortfall is still significant, with 115,415 fewer bales sold so far this season compared to the same period last year. This equates to an average weekly gap of 8,878 bales.

The dollar value for the week was $52.97 million, for a combined value so far this season of $565.68 million, and a bale average value $1,732.

Crossbred were the worst performing category this week, losing 10 to 55 cents across the microns. After last week’s losses, the Cardings Indicators again held their ground with just a 5 cent average fall.

The week ahead

A smaller offering is rostered for sale next week of just 32,970 bales. Sydney is down to just one day of sale on Wednesday, while Melbourne and Fremantle are selling both Wednesday and Thursday.

Let’s hope the positive tone moving through the market at the end of this week carries through.

Spring mutton dressed up as lamb

There has been plenty of commentary around the spring rally in mutton prices and last week we saw the unusually strong prices almost hit a record in Victoria. Sheep markets have rarely been stronger and normally it’s the price low that we see at this time of year. So should growers be selling ewes rather than lambs?

The credit for rising mutton prices has been squarely placed with Chinese demand. Increasing demand can be the only answer when we see price rises like the one shown in Figure 1.  The 10% rise in the Victorian Mutton Indicator from the low has been accompanied by an 11% increase in slaughter. Rising supply and rising prices equals stronger demand.

The Victorian Mutton Indicator is 61% stronger than the same week last year. That is more easily explained by supply, with east coast sheep slaughter down 22.5% on September last year.

The relative price of mutton has also hit some milestones. The Victoria Mutton Indicator last week moved to just a 23% discount to the Eastern States Trade Lamb Indicator (ESTLI). Mutton hasn’t been this close to lamb since May 2018, although it was in October 2016.

Figure 2 shows the steady ESTLI and rising mutton price has the spread at levels well above the normal range for this time of year.

As we move towards the end of spring and paddock feed supplies start to dwindle, sheep producers will start looking at what to sell. We know that sheep and mutton both have further potential upside, but it looks like there might be more upside in lamb.

Lamb prices averaged 10% higher than current prices in May, June and July, while mutton values have rarely been higher. Cast for age ewes are very good selling at the moment, as are lambs, but there is likely more upside in young stock than old. This is especially the case for young female stock when the drought breaks.

What does this mean?

Strong mutton prices make selling decisions relatively easy this year. Older ewes might have another 5% upside in the meat market but lambs are more likely to rise, and will rise further.  In order to conserve feed, any older ewes which are left can be cashed in, and efforts concentrated on finishing lambs or getting ewe lambs up for joining. Young ewes are going to be the real winners when it rains.

Lower production, lower prices

Many crop forecasters are calling the crop lower. It is therefore confusing for many why the price for cereals is dropping rather than rising. This time last year ASX wheat was A$444/mt, this week it is trading at A$353/mt. Why is that happening when the crop is in poor condition?

A small crop gets smaller is an adage that stands the test of time in Australia. The estimates for this year’s wheat crop are varied from 15.5mmt to 18mmt. I personally think the headline number is irrelevant. In a year like this (and last year), we need to be thinking of Australia as two countries – east and west.

I have mentioned a number of times in our weekly podcast and a number of articles (here, here & here) that the distribution of grain in the country would lead to lower prices than last year. The headline number is liable to be around similar levels to last year, but that doesn’t mean prices will be the same.

The ASX wheat contract rose during September, however, it has remained locked within a narrow trading range of A$350 to A$360 (Figure 1). In the past week, we have seen a softening of pricing with the average close this week at A$353. This is A$88 lower than the same week last year.

The ASX falling has come at a time when CBOT for a comparable period has been rising. This has resulted in basis falling to A$67. The high in recent months has been A$112.

Recent times have seen corn being the main driver, however, wheat led the charge in cereals overnight. This has resulted in December futures riding to a three month high. The market has been driven by wheat concerns around the world cold/snow (US & Canada) and dry (Australia & Argentina).

Early in the season, Argentina was on track to produce a record-breaking crop, with estimates up to 21mmt. However dry weather has resulted in a series of downgrades to 19.8mmt. This is 300km higher than last year and nearly 5mmt higher than the decade average (Figure 2). Although we may see production fall further, the impact on the record global balance sheet is likely to be minimal.

Next week:

The ASX market has fallen over the past week and is testing <A$350. If this occurs, we may see an uptick as consumers cover requirements at a lower level.

It is going to be a very volatile harvest as what grain that has been produced comes to market over the next two months.

Markets primed for rain

Measures of cattle supply across the east coast probe lows not seen in many months and prices across categories are mixed on the week. The reduced supply points to a chance for a rally but the lack of rain is hampering the bounce, despite solid offshore demand and strong export prices.

East coast cattle slaughter levels dipped in recent weeks to record the lowest weekly figure recorded since the Easter hiatus this season. Weekly slaughter levels dipped below the 2018 trend for the first time since early August and are running 11% softer than where it was a month ago (Figure 1).

East coast yardings are displaying a softer trend too, with the lowest weekly figure recorded since mid-June. Since the end of September, average weekly east coast cattle yarding levels have been running 7% below the five-year seasonal pattern, further reflecting the tight supply (Figure 2).

Young cattle prices on the east coast have responded kindly to the tighter scenario with the Eastern Young Cattle Indicator (EYCI) lifting 3.5% to close at 503.25¢/kg cwt.  East coast feeder steers also managed a slight gain, up 2.25¢ to 286.5¢/kg lwt.

East coast heavy steers were less reactive, with a 3.5¢ drop to close the week at 309¢/kg lwt. Despite the weekly easing, east coast heavy steers remain at a premium to the EYCI as tight supply of quality finished cattle and a lack of rain continues to favour the heavier stock.

Next week

The BOM issued rainfall forecast for the next fortnight signals limited to no falls in all regions but the western half of Tasmania (Figure 3). Young cattle prices will continue to face headwinds while the rain outlook remains pessimistic.

There remains some good upside potential for prices should the climate start to comply.  The 90CL beef export indicator lifted again to 755¢/kg CIF and the Mecardo analysis published yesterday on the 90CL indicates that the EYCI could go to a 50¢ premium to the 90CL if we get a decent enough break in 2020.

All red for sheep and lamb

Seeing all red on the Eastern States Daily Indicator Report for weekly sheep and lamb movements has been a rare occurrence recently.  This week finally saw enough stock come to market to send prices lower.

Week on week falls in sheep and lamb prices weren’t huge, but the Eastern States Trade Lamb Indicator (ESTLI) did hit a five-month low, breaking under 800¢ for the first time since May (Figure 1).  The ESTLI isn’t far off where it was after a brief spike in October last year, but it has found plenty of support around this level.

Merino lambs were the heaviest hit in terms of falls, the east coast indicator lost 44¢ to hit 716¢.  The Merino lambs seem to be coming in NSW, where they are 707¢, while in Victoria they are stronger, at 751¢.  This is the opposite spread of trade lambs, which tells us merino lambs are flowing in NSW, trade lambs are not.

Lamb slaughter was lower last week, but that was due to a public holiday.  Slaughter is likely to be higher this week but looking at last year’s trends (Figure 2) it could gain another 10%, which would put some pressure on prices.

The weaker Aussie dollar is giving lamb prices some support.  In US terms the current ESTLI premium over last year’s low is 100¢, in our terms it’s at 125¢.  There is likely to be a downside, but we don’t think it will hit last year’s levels.

Next week.

The fortnightly Bureau of Meteorology (BOM) outlook is a bit more positive this time.  Figure 3 shows the December to February outlook, we left November out as it’s not great.  We might have to wait until the New Year to see the rain, which will bring the price upside.  In the short-term downside is more likely, but it won’t last long.

Early flush soaked up by offshore players

Lamb yarding numbers are starting to climb across the east coast fueled by lifting Victorian throughput as the spring flush gets underway. However, prices are yet to dampen as a resurgence in offshore demand, particularly from China has export buyers scrambling to fill orders.

Weekly east coast yarding levels reached the highest they have been since late July jumping 26% from the prior week and is closing in on 180,000 head (Figure 1). Driving the east coast volume of lamb is the lift in Victorian numbers signalling the early stages of the spring flush.

Victorian lamb throughput is 104% up on levels from a month ago and is nearing 50,000 head per week. Despite the additional volumes most categories of Victorian lamb prices increased this week indicating demand is more than compensating for the extra supply (Figure 2).

Indeed, lamb and sheep prices have lifted across all categories reported by NLRS for eastern states indicators, with restocker lambs, light lamb and mutton leading the charge higher. East coast Restocker Lambs posted a 19¢ gain on the week to close at 878¢/kg cwt, Light Lamb is up 20¢ to 800¢ and East coast Mutton is performing exceptionally well (particularly in percentage terms gains) with a 19¢ lift to close at 605¢.

September trade exports figures give us a clue as to why lamb and mutton prices are holding up so well in the face of the start of the spring flush. This is particularly true for flows going to China to fill the protein void created by the African Swine Fever (ASF) epidemic. Mutton flows from Australia to China have increased 208% from July to September and year to date Chinese demand is running 108% above the five-year seasonal trend (Figure 3).

Next week

The strong resurgence in offshore demand for Australian lamb and mutton product is timely given that throughout volumes are set to extend higher as we proceed through spring. The big unknown is how large the appetite from China will grow as we head toward the end of the season.

There is a good chance that an ASF led lift in Chinese demand for mutton and lamb, over and above the normal spring increases in Chinese trade volumes, will see prices underpinned throughout the next few months. This will limit the depth of the traditional spring flush price decline.