Year: 2019

January records smashed for lamb exports

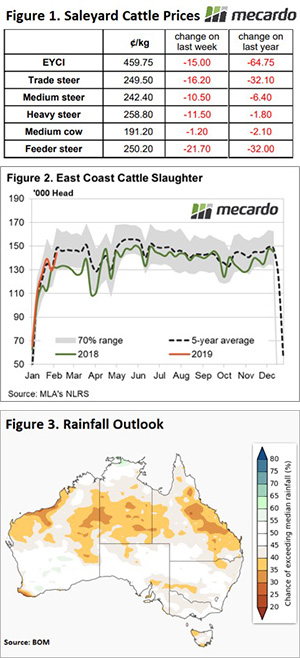
Department of Agriculture and Water Resources (DAWR) trade statistics for January show a 15.6% year on year increase in lamb exports and the gains in mutton export flows aren’t far behind, up 15% on January 2018. Despite posting similar volume gains, a breakdown of key destinations for the lamb and mutton export trade shows that the growth in demand is being driven from different regions.

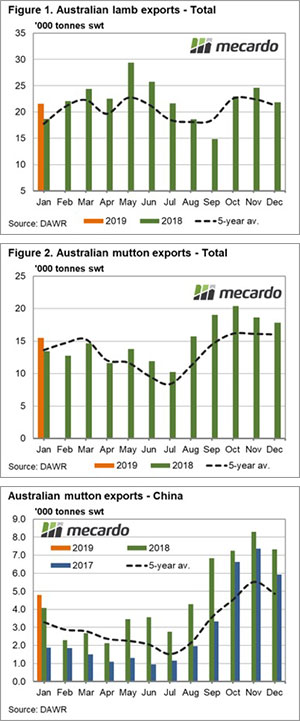
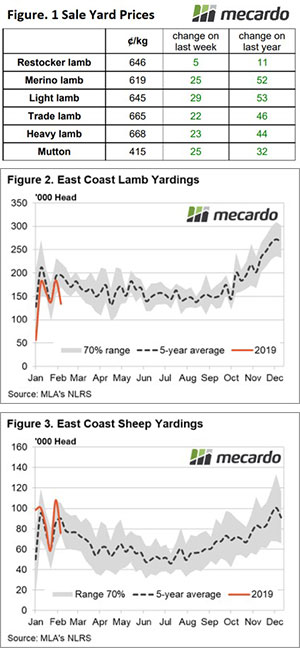
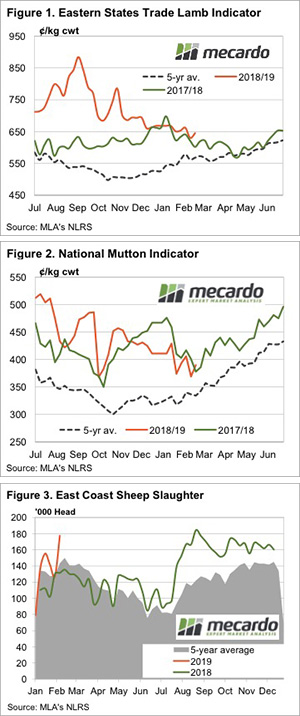
Total lamb exports from Australia were reported at 21,541 tonnes swt, the highest January volume on record and coming in 21.4% higher than the five-year seasonal average for January – Figure 1. The January 2019 lamb export volumes were 15.6% above the 2018 level, boosted by record flows to the Middle East and the USA.

Australian lamb product to the Middle East totaled 6,487 tonnes swt, the highest January total on record, 25% up on January 2018 and 36% higher than the five-year average trend. Even stronger percentage gains were noted for the USA with the January 2019 lamb export volume of 5,593 tonnes swt also posting the highest January figure on record, increasing by 35% on January 2018 levels and 38% above the five-year average for January.

Mutton exports out of Australia for January 2019 show a similar lift in volumes, increasing 15% year on year to 15,485 tonnes swt – Figure 2. However, the significantly above average volumes for mutton during January were limited to Asian destinations, namely China, Singapore and Taiwan, to see the January flows sit 13.7% above the January five-year average.

Growth in mutton flows from Australia to China were up 18% year on year for January to see 4,805 tonnes swt consigned, the second highest volume for January and just a fraction short of the record 4,822 tonnes sent during January 2014 – Figure 3.

What does it mean/next week?

Last week we reported on strong beef export numbers for the start of 2019, fueled by growing Chinese demand, to see China overtake South Korea as the third top destination for Australian beef exports.

Perhaps the issues faced in China currently regarding African Swine Fever (ASF) and the reports of nearly one million pigs being culled due to the contagion are beginning to flow through to additional demand for alternative proteins, such as beef and mutton. It is early days yet, but it will be worthwhile to keep track of the ASF developments in China as the season progresses to determine what impact, if any, it is having on our export markets.

Key points:

  • Lamb exports recorded the highest January monthly total on record coming in 21.4% above the January seasonal five-year average at 21,541 tonnes swt.
  • Lamb consignments to the Middle East and USA underpinned the strong January results, with both destinations registering record January flows.
  • January mutton exports were supported by Asian demand growth, coming in 13.7% higher than the five-year average for January at 15,485 tonnes swt.

Sausages, coal and interest rates

The grain market is not only steered by agricultural factors, many of the driving forces behind price movements are out with the industry. In this weeks grain comment we look at how sausages, coal and interest rates can have an impact on our industry.

In yesterday’s grain analysis “Don’t get caught in the basis bubble”, I discussed the issues around overseas values plummeting. Overnight there was a small correction, albeit remaining very close to contract lows.

In figure 1, the APW1/CBOT basis is displayed from 2016 to present. As we can see our premium over Chicago increased dramatically during the second half of last year as drought bit hard. These level smashed all prior records.

As we can see, the basis level has dropped dramatically in the post-harvest period. If we get an average harvest the basis level will converge back with new crop pricing; at a level closer to historical ranges. The basis has saved our pricing, but there is limited chance of these levels being around during harvest (unless we have a drought).

Nationals senator Barry O’Sullivan, caused uproar in China with comments related to biosecurity:

there’s a bigger chance of us having a biosecurity breach by some bloody old Chinaman who brings in his favourite sausage down the front of his undies

It’s clearly not a great idea to insult the countries most important trading partner. There are rumors that this comment and festering tensions could lead to barley being impacted with an anti-dumping tariff in the coming month.

It is reported that the port of Dalian has banned imports of Australian coal which could be a symptom of deteriorating trade relations. The A$ dollar was under some pressure as the market digested the information. At present Dalian only receives <2% of Australian coal exports, however coal exports remain Australia’s most valuable export, and contagion to other ports would have a dramatic negative impact on the economy.

In 2018 it was widely expected that rate rises would commence in 2019. There are now forecasts of not one but two interest rate cuts in 2019. These two cuts (predicted at 0.25%) will reduce interest rates to 1%. The current record low rate of 1.5% has been held since August 2016 (figure 2).

A reduction in interest rates will lead to a fall in the A$ which will benefit exports but will increase the cost of our import requirements. If the rates are passed on, it will provide cheap money for investment purposes.

What does it mean/next week?:

The world looks towards the northern hemisphere weather. At present conditions are good, and in places excellent.

However there is still ample time for disasters to occur.

Signs of tightening supply

A nice lift in prices across the board for all NLRS reported categories of lamb and sheep along the East coast this week, as saleyard throughput figures suggest supply is on the wane. The Eastern States Trade Lamb Indicator (ESTLI) gaining over 3% to close at 665¢/kg cwt.

Prices lifted between 1-6% on the week, with Restocker Lamb the worst performer of the bunch managing a meagre 5¢ lift to close at 646¢ (Figure 1). In contrast, East coast mutton was the standout jumping 6.4% to finish the week at 415¢/kg cwt.

East coast lamb yarding levels provide a clue to the current price behaviour. Throughput has eased 27% from the week prior to see the 2019 trend dip below the normal range for the first time this season with less than 135,000 reported through the saleyard last week. Indeed, since the start of the year average weekly lamb throughput levels have been running 14% below the five-year trend (Figure 2).

East coast sheep yardings posted a dive of a similar magnitude too, registering a 29% drop week on week. Despite the reduced sheep numbers, weekly levels remain just within the normal range at around 75,000 head as above average weekly NSW sheep throughput stems the broader east coast decline in sheep numbers (Figure 3).

Since the start of 2019, average weekly sheep throughput in NSW has been running 14.5% above the five-year average level. In contrast, Victorian sheep yarding levels have been trending 9% below the five-year average, while South Australian sheep throughput has been 20% softer than the seasonal average.

Next week:

There is nothing of note in terms of rainfall on the BOM weekly forecast for sheep and lamb rearing regions, but the dwindling supply is probably enough to keep prices sustained as we head toward Autumn.

Don’t get caught in the basis bubble.

Shocking production brings sensational prices. During the past six months grain producers have been dejected by production or elated by prices. As we move into seeding it is important to understand that Australian prices are held up by a bubble of basis. Will the bubble burst?

Australian wheat prices in all zones are at very attractive levels. It is important not to be too distracted by these prices as we move into the new growing season. Our prices in a typical year are dominated by the export market, this year domestic deficits ruled the state of play.

The most important factor to remember in marketing in grain is basis. This is not a complicated term, it is merely the difference (premium or discount) between two pricing points. In most discussions around wheat we refence basis between the physical and Chicago futures price. However, it could just as easily be the basis between our price and London feed wheat futures.

The reason I used the term bubble in this article, is that the basis levels currently experienced will only be maintained if we see major production issues in the coming season. If we receive an average to above average crop, our prices will again be weighted towards exports.

Therefore, it is extremely important to look at both local and overseas levels, especially as we move closer into the planting window.

The futures market has received a beating during the past week with spot futures back 8% since the start of the month. This equates to A$19, a considerable fall in anyone’s books (figure 1). At a seasonal point of view the market is largely following the expected trend albeit more sharply than normal (figure 2).

In figure 3, the average February price for the following December is displayed, along with the current price (green bar). At present the current average for February is highest since 2014, however with another week to go, we could see this slip further.

So why are global prices falling?

  • Demand from North Africa is declining
  • US wheat is uncompetitive versus other origins (Argentina & Russia)
  • Initial reports are positive for the coming crop in a number of origins

What does it mean/next week?:

It’s not all doom and gloom yet, there is still a long way to go between now and harvest. However, it is vitally important to understand the risk in the market.

Currently Australian producers can extract very strong prices as a virtue of our domestic deficit on the east coast.

These premiums over international values will not be sustained if we have a reasonable crop next season. Therefore, our prices will have to reduce to meet international demand, if we see global values fall, our levels will come in line.

At present producers on the east coast are able to access the ASX Jan 2020 contract at A$335, a basis level of A$72.

Key Points

  • Basis levels in Australia are at historically high levels.
  • Overseas values are under pressure.
  • The basis levels experienced in Australia at present will not persist unless there is a 2nd disastrous year.

Market pays no heed to supply warnings

With everything pointing towards lower cattle supply, and grain prices on the wane, we would think the market should start taking heed at some stage. It was not this week though, with the downward trend in cattle prices extended.

Figure 1 gives a fair idea as to why cattle prices continue to fall. It has been four years since east coast cattle slaughter has been this strong at this time of year and it’s running 10% ahead of this time last year.

Interestingly, heavy slaughter cattle prices are not that far below last year. The National Trade Steer is 19¢ below the same time last year, but Heavy Steers are 2¢ better (Figure 2). Restockers and Feeders are dragging the chain, and the Eastern Young Cattle Indicator (EYCI) is now 72¢ off last years levels, at 449.5¢/kg cwt. The EYCI hasn’t been below 450¢ since April 2015 so looks like good buying.

Helping support finished cattle prices are rising 90CL export values. This week the price in US terms gained 6.5¢, while in our terms it was up 25¢. Figure 3 shows the increase in export values is nearing a 3 year high. In US terms the 90CL is heading towards a 10 month high.

It’s not surprising given the cheaper grain and better season, but the Western Young Cattle Indicator remains at a premium to its east coast counterpart. The WYCI is at 493¢/kg cwt, but well behind over the hooks prices. The WA MSA Steer is the most expensive in the country at 580¢/kg cwt, 40¢ ahead of this time last year.

What does it mean/next week?:

There’s no rain on the forecast and as such, it’s hard to see too much of a price rise on the cards.  However, the closer we get to an autumn break, assuming it’s coming, the closer we are to a rally.  The key to picking the market will be buying before the rain hits, which as we know from the ongoing dry, is not as easy as it sounds.

Wool market Springboks past 2,000 cent mark

If we were to think of what “black swan” events might impact the wool market in 2019, Foot and Mouth Disease (FMD) outbreak in South Africa (SA) would not have been high on the list.

This, however, has been the case as this week China decided to bypass SA wool auctions, leading to Cape Wools SA deciding to suspend wool sales this week.

This decision was on the back of an outbreak of FMD identified in January in the Vhembe district in Limpopo.

The Eastern Market Indicator (EMI) surged on opening in Melbourne on Monday, gaining 59 cents by the end of the week to 2,027 cents. The last time it settled above 2,000 cents was in October 2018. The Au$ was again slightly stronger up 0.57%. This resulted in the EMI in US$ terms was also dearer, up 50 cents to end the week at 1,451 US cents (Table 1).

In Fremantle, the Western Market Indicator (WMI) was also pumped by the events across the Indian Ocean, rising 31 cents to end the week at 2161 cents. This is also the highest level since October 2018.

42,029 bales were offered for sale this week, with the trade clearing 39,447. Again, growers were impressed with the market and passed in only 6.1% or 2,582 bales.

The dollar value for the week was $83.56 million, for a combined value of $2.14 billion so far this season.

In the auction weeks since the winter recess, 975,539 bales have been cleared to the trade.

All types benefited from the strong market, however later in the week there was evidence that buyers may have been over exuberant and markets retreated from the peaks of Wednesday.

The week ahead

According to the AWEX roster, the next week 49,738 bales are predicted, with a designated Australian superfine sale in Sydney. This is a significant jump up from volumes rostered last week as strong prices are enticing sellers to come forward. 38,813 and 36,460 bales are rostered for the next two weeks.

While it is disappointing for our wool producer friends in South Africa, the continued uncertainty around China’s intentions should see our market at least sustained at these levels in coming weeks.

Weekly Wool Forwards for week ending 22 February 2019

Last week we tipped more activity on the forwards market in the coming weeks. What we didn’t expect, was the driving force behind the spike to come from South Africa. With China suspending all greasy imports from SA, overseas buyers have pounced on the Australian market to secure supplies through this uncertainty.

Sixteen trades dealt in total over the week, despite a lift in the AUD to 0.716 in US terms.

In the fine wool category, 19 micron wool traded at 2,310¢ for May 2019. Contracts for October 2019 dealt in a wide range between 2,190¢ and 2,260¢, while November saw deals struck at 2,200¢ and 2,225¢.

Sellers were happy to look well ahead to lock in some prices. February 2020 contracts traded at 2,200¢ for the 19 micron. Deals were also struck for October and December 2020, and even January 2021, at an agreed price of 2,075¢.

In the medium fibre category, we saw 21 micron at 2,290¢ for February 2019. June 2019 landed two deals at 2,240¢ and 2,260¢, while October and November traded at 2,150¢.

Wool supply issues in the north

The drought is showing its effect especially in the northern selling centre (Sydney), where a very small offering of 7,500 bales last week met with strong competition.

The south and western selling centres provided the bulk of the offering with 23,000 & 9,500 respectively, while the solid demand was widespread across all centres.

The Eastern Market Indicator (EMI) gained 24 cents to accumulate a 57 cent rise this calendar year, ending the week at 1,968 cents. The Au$ was again slightly stronger up 0.4%; the EMI in US$ terms was also dearer up 21 cents to end the week at 1,401 US cents (Table 1).

In Fremantle, the Western Market Indicator (WMI) continued to strengthen, rising 29 cents on the back of a solid performance since December last year to end the week at 2130 cents.

40,000 bales were offered for sale this week, with the trade clearing 38,030. Again, growers were impressed with the market and passed in only 5.3% or 2,135 bales.

It must be a strong market as Fremantle had a low pass-in rate, in fact on the final day 97% of fleece wool in the west was cleared to the trade providing the lowest pass-in rate since September.

The dollar value for the week was $83.28 million, for a combined value of $2.06 billion so far this season.

In the auction weeks since the winter recess, 864,304 bales have been cleared to the trade, 212,117 fewer than the same period last year. The average shortfall cleared to the trade compared to the same time last year now sits at 8,484 bales per week fewer.

All types benefited from the strong market, 28 MPG up 50 Cents for the week in Melbourne, while Skirtings and with the Cardings indicators all had a good week to end dearer across the board.

The week ahead

It is with some degree of confidence that we can look forward to the next few weeks at least. According to the AWEX roster, the next week 42,400 per week are predicted, with 35,000 and 36,000 bales the next two week.

Buyers are filling orders as best they can with limited offerings, especially noted is the lack of low VM, high N/KTex wool styles which continue to be highly sought.

When 620¢ is no longer enough.

Late last week the lamb and sheep market found some strength.  Prices will only fall for so long before grower baulk and put other strategies in place.  Either supply has run out, or producers are holding off.  Either way it looks like we might have seen the bottom.

It took until later in the week, but the Eastern States Trade Lamb Indicator (ESTLI) and the National Mutton Indicator both jumped higher yesterday.  Based on the individual saleyard reports we know that supply was back, and even with a lot of lambs going direct to works, buyers had to battle it out.

The ESTLI finished the week up 22¢ at 643¢/kg cwt (figure 1).  This is after hitting a low of 621¢ on Tuesday.  The major market mover was Wagga, with higher prices on big yarding, while in Victoria yardings were well back, and prices higher.

The National Mutton Indicator was also higher, but figure 2 shows it hasn’t broken its downward trend.  It will have to go back past 420¢ before we can say that.

If you’re wondering why mutton has gotten cheap, figure 3 gives a pretty good idea.  Last week east coast sheep slaughter was at level which has only been beaten three times in the last 3 years.  That was last August.

WA and SA had the most expensive trade lambs this week.  Both sitting at 667¢/kg cwt, they are well ahead of last year, but likely have upside potential.

What does it mean/next week?:

It will be interesting to see if the price rise last week is enough to see lambs come back to the market. We wouldn’t really think so, but on the other hand processors do have a lot of lambs booked up, so prices aren’t going to go crazy.  For now.

I see red, I see red, I see red, and it’s not Valentine’s roses.

Softening cattle prices across the board this week and all major NLRS reported categories of cattle across the East coast are now below levels recorded this time last season, including Heavy Steers, albeit marginally. However, some respite may be on the horizon thanks to an improved BOM outlook.

East coast cattle sale yard prices and movements, for the week and year, are listed in Figure 1 and it shows there wasn’t much romance for cattle producers during Valentine’s week. Feeder Steers posting the largest percentage fall with an 8.7% decline to close at 250¢/kg cwt live weight, 11% lower than where they were this time last year.

The Eastern Young Cattle Indicator (EYCI) registering somewhat muted declines, peeling off 3.3% on the week to finish a whisker under 460¢/kg cwt. Remaining steer categories easing between 4%-6.5%, while Medium Cow managed the best with the slightest of declines to close the week at 191¢/kg lwt. Young cattle in Western Australian markets also managing to trek sideways to see the WYCI finish just a few cents under 500¢/kg cwt.

Cattle slaughter levels since the start of 2019 have been closely following the five-year average seasonal pattern but have been running 8.6% above the levels seen last season. The additional supply a possible reason why we have seen cattle prices drift below levels recorded this time last year – Figure 2.

The Bureau of Meteorology (BOM) providing a bit of a Valentine’s gift for cattle producers though. Their preliminary three-month rainfall outlook, released on the 14th of February, showing a reasonably average start to the Autumn break for nearly all the Southern regions and patches of slightly drier areas in North Western WA, southern NT and Eastern Queensland – Figure 3.

Offshore beef export markets in the US also offering some love with the 90CL climbing to its highest level since mid-2017 to close above 625¢/kg CIF as a combination of reduced imported offerings, improved domestic US prices and increased US domestic demand have helped support imported grinding beef levels.

Next week

The combination of solid beef export prices and the first sign of an improved rainfall forecast should be enough to provide some support to cattle prices in the short term. A more in-depth rainfall outlook will be provided by the BOM at the end of the month and the closer we get to Autumn their forecast accuracy improves and may begin to encourage some restocking, at least in the south.