Year: 2019

How does StockCo assist livestock producers to achieve better outcomes?

StockCo can assist producers emerging from a destocking event, for example, a drought and our facility helps them to return to generating profits really quickly after a favourable weather event. StockCo’s product can assist producers to really maximise the return on their assets and effectively, this provides them with further income or further revenue to help service their bank facilities or growth projects.

StockCo’s funding can help provide additional capital to our customers to help them grow their numbers which assists when acquiring new properties or on the back of a large development program where they’ve increased their carrying capacity.

Another good example of where StockCo’s facility can be really beneficial to our customers is where we have an existing customer who wants to defray an existing fixed cost, fixed operating costs, over a larger income stream or a larger revenue stream. And they can do this a number of ways, whether they go into a leasing agreement to lease further country or agisting further country.


EU wheat at a discount

In this week’s grain market update we take a look at the new crop contracts overseas now that we’re approaching the northern hemisphere harvest.

The Chicago wheat futures show some small gains at the start of the week, however overnight lost all of the weeks gains (and then some). The contract ended the week down 2%, or A$5 (Figure 1). This was due to US wheat exports for early January being lower than expected.

As we get close to the northern hemisphere harvest, the reliance on old crop starts to diminish as exports will start from the new pile.

This can be seen in the forward curve for Matif which is currently in backwardation (Figure 2). In a market experiencing backwardation, the forward future months will be priced at a discount to the spot futures market. A market in backwardation suggests that supplies are currently short, and buyers want the commodity now as opposed to the future. In essence this encourages sellers with stocks to sell now rather than hold, as the commodity is discounted in forward contract period.

It is still early but European and North American weather looks favourable to the crop, therefore the trade expects to see better production for the coming crop. This means there is less requirement (at present) to pay large premiums.

What does it mean?:

The BOM have released their 3 month climate outlook (Mar-May) with the majority of Australian growing regions forecast to receive median rainfall. Although long range forecasts need to be taken with a pinch of salt, it is positive compared to prior predications.

Prediction is very difficult, especially if it’s about the future.

The rainfall and production prospects for the coming year are an unknown, will it be colossal or dreadful? The reality is that no-one really predict weather out 12 months with any degree of accuracy – not even astrologists. In this article we look at the ASX contract and whether it provides an opportunity for the coming season considering the drought premiums in the market at present.

The January ASX contract typically receives the highest level of attention, this is due to it aligning with the east coast harvest. The ASX contract could be a potentially fantastic risk management tool for producers and consumers, however liquidity has been an issue.

The January 2019 contract expired last month at a very attractive (for producers) A$434 due to the sustained drought through the past year. Since the contract expired, the open interest in January 2020 has increased dramatically (figure 1).

There have been many consumers who have experienced historically high procurement costs who are seeing the current pricing levels for next year as being high; but lower than last year.

In September, I pointed towards selling ASX for Jan 2020 as being a solid strategy (see here). The market at that point was in the A$369-374 range. The market then fell to A$330, which would have provided an on paper profit of A$39-44/mt. At the time we advised this is an opportunity for growers to hedge their 2020 crop and for consumers to recoup some of the losses of this season.

The market has started to creep up as consumers attempt to gain some cover for the coming year and concerns related to soil moisture as we head into seeding. Since the start of February the contract has traded at an average of A$343 (figure 2).

In figure 3, the December basis between ASX and CBOT is displayed for the January contract. This chart represents both the old NSW contract and the east coast contract as they are analogous. It is clear the basis level received during harvest this season was an outlier. The premium over CBOT was A$172/mt, versus a decade average of A$26. At present the Jan 2020 contract is at A$63 over, which would be considered ‘mild’ drought pricing.

What does it mean/next week?:

As mentioned in the preamble to this article, no one knows what will happen over the rest of this year. We could receive a bountiful supply of rain and grow a record crop, conversely, we could have a season worse than the last.

The current pricing levels for Jan 2020 would be considered very strong (if you remove 2018). It is my view that marketing plans should be conducted in chunks and if >A$340 is the worst price you receive for the coming season – that’s not a bad end result.

Key Points

  • The ASX has struggled with liquidity in recent years, however consumers are more readily accepting it as a risk management tool.
  • Historically attractive prices are on offer for the 2019/20 harvest.

Weekly Wool Forwards for week ending 15 February 2019

An interesting trend has emerged this week in the auction market, where we’ve seen continual heightened prices across all micron categories. When coupled with the Aussie dollar on a continued downwards trend, one could expect that the forwards market could see more and more action in the coming weeks.

In the 18 micron category, one trade was dealt for June with the agreed price of 2350¢/kg.

In the 19 micron category, six trades were dealt. One was agreed for next month for 2285¢/kg. Two trades were dealt for May between 2240¢/kg and 2250¢/kg. Two trades were made for later in the year, November and December both agreeing at 2125¢/kg. The remaining trade was made for February next year for 2085¢/kg.

In the 21 micron category, two trades were dealt for April, one for 2200¢/kg and the other for 2220¢/kg.

While the Aussie dollar did rally slightly at the end of the week, the downward trend is still evident.  Throughout the time that this remains the case, activity from overseas buyers should be higher. The forward market has been very active for several weeks now, generally ignoring the fluctuating Aussie dollar value. This could hint that supply might still be a concern looking into the near future, but also could reflect an overseas comfort with the broader picture of Aussie dollar levels and trends.

For this weeks’ article investigating wool supply issues in the north see here

Supply forecast provokes aggressive buying.

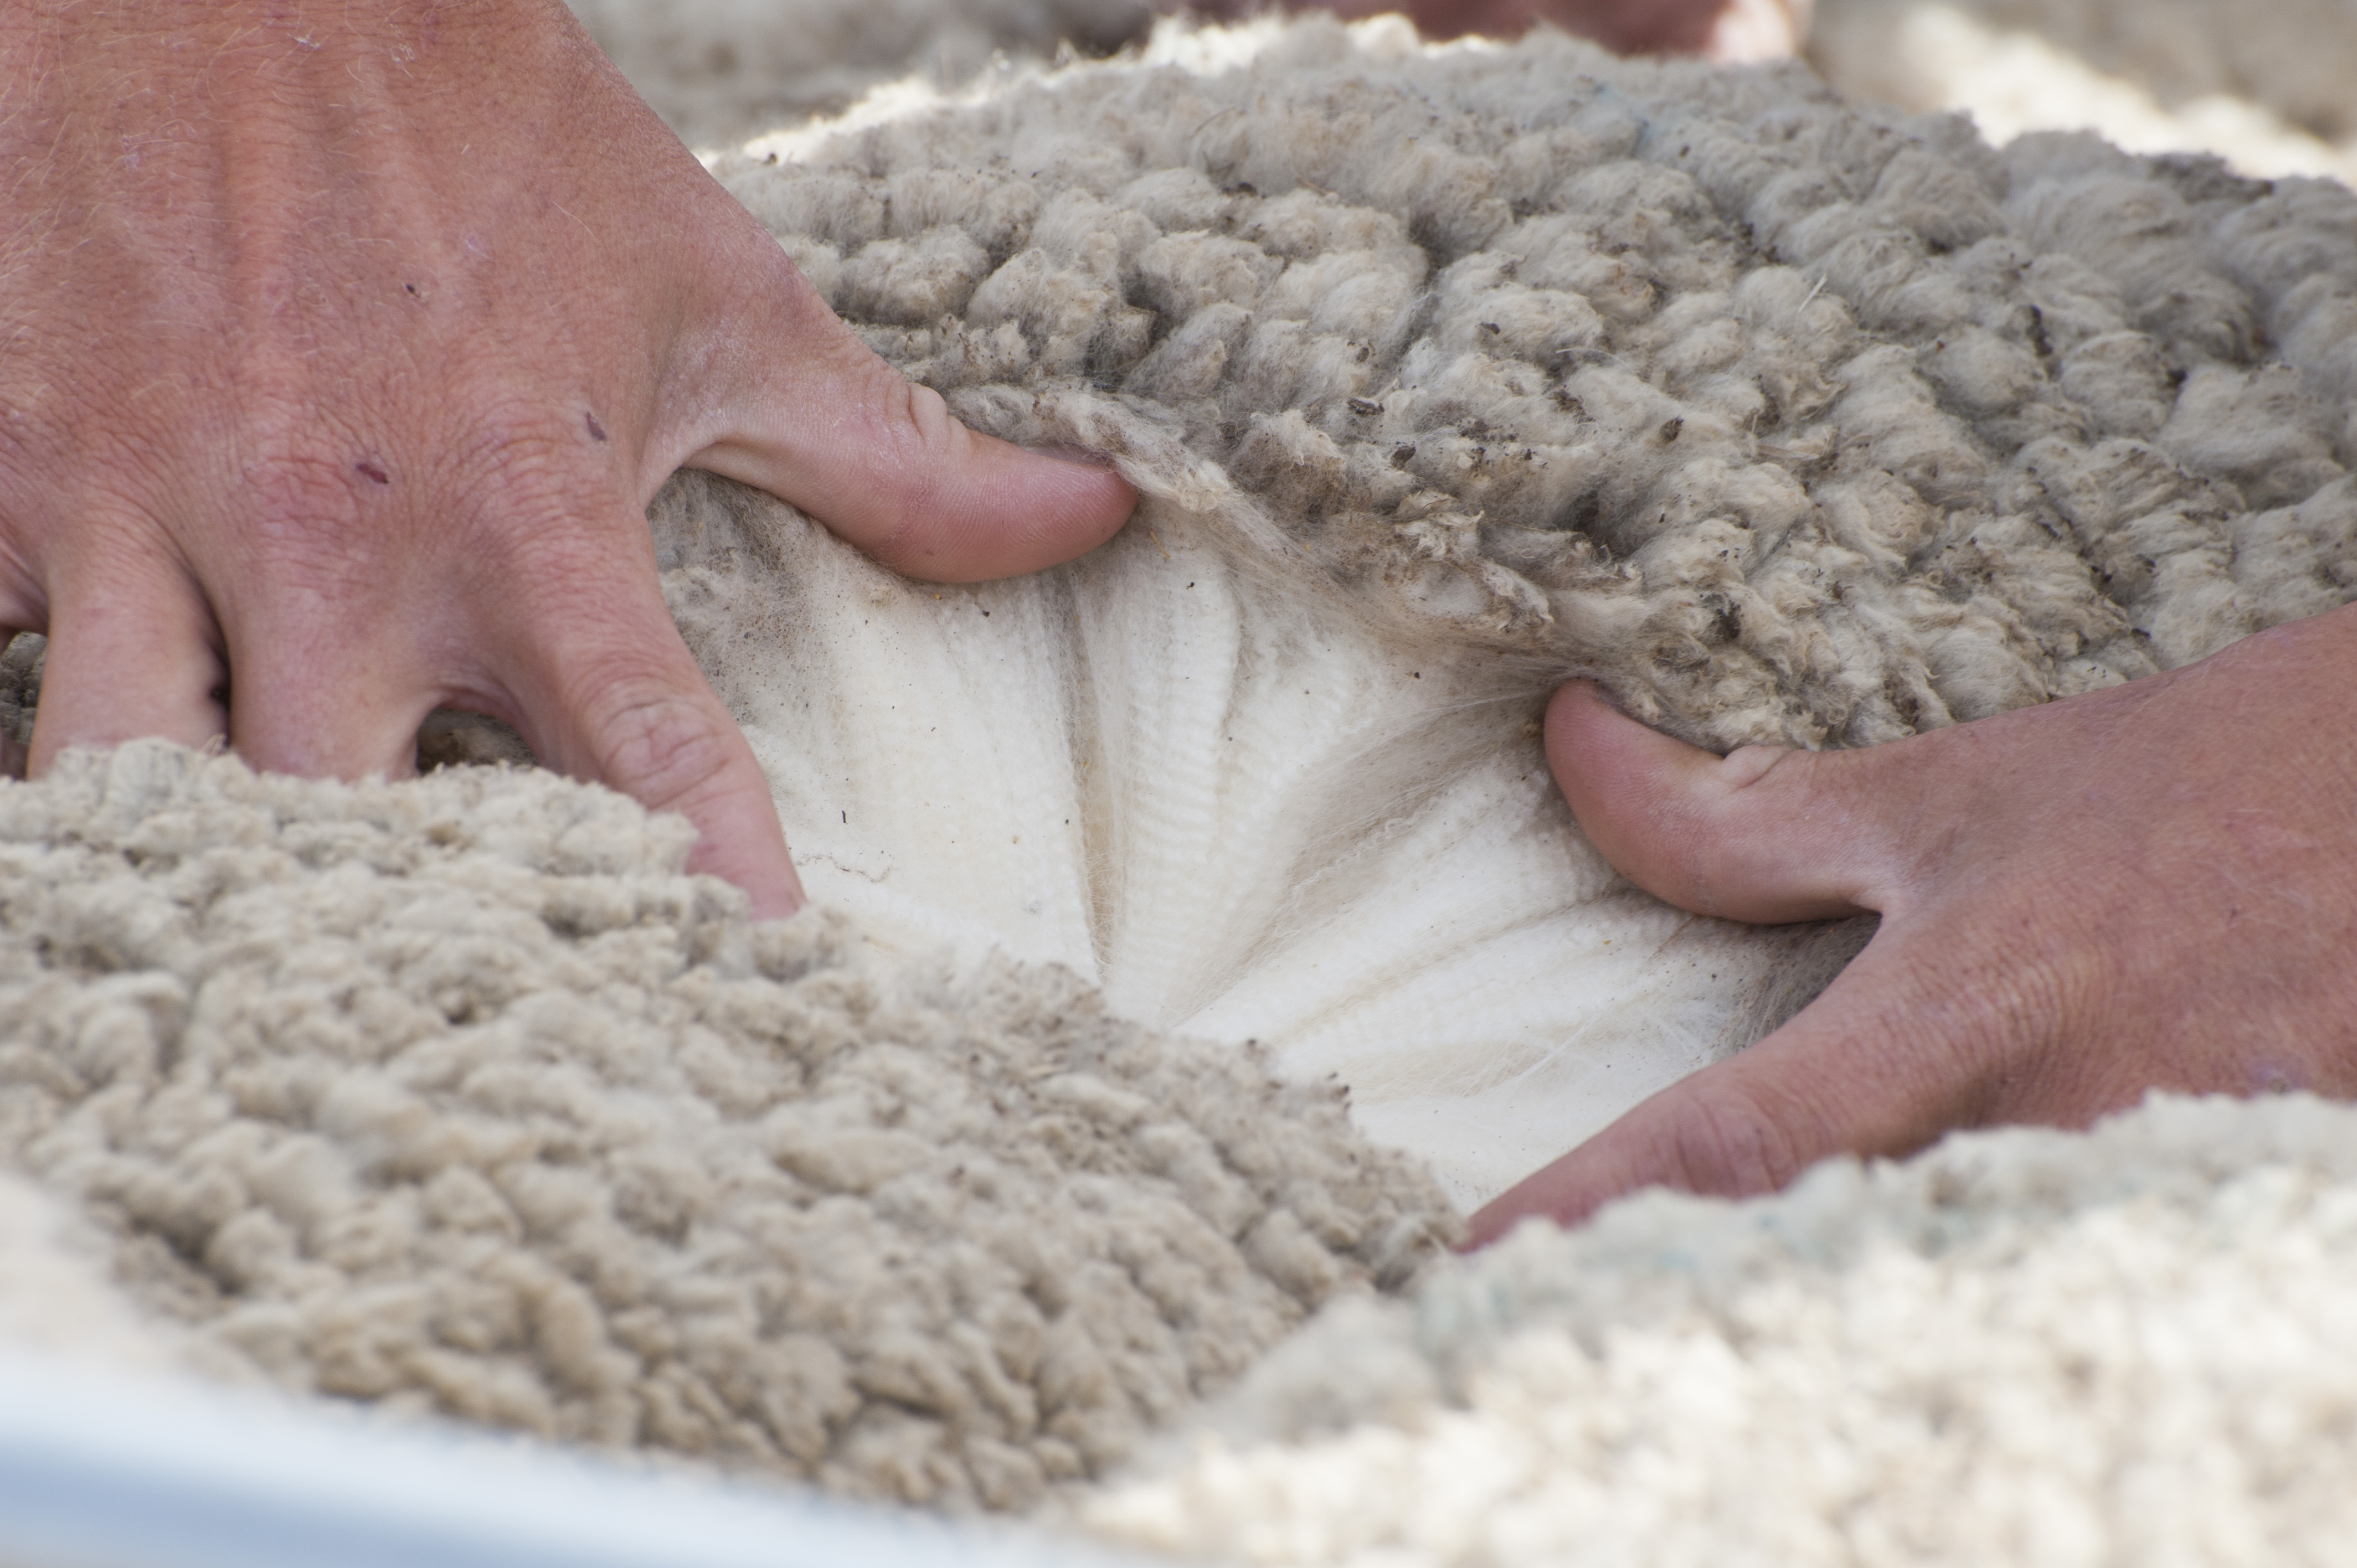
Despite a slight lift in volume of wool hitting the market this week prices managed to increase across most categories and centres. Looking ahead however, the roster indicates that the quantity of wool on offer is set to decline week after week.

AWEX reports claim that the forecast has led many exporters to attempt to secure volume while it’s available and sparked more aggressive buying behaviour this week.

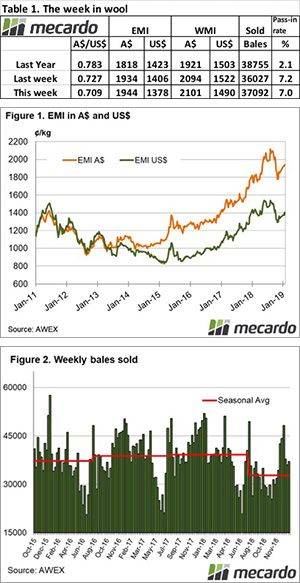
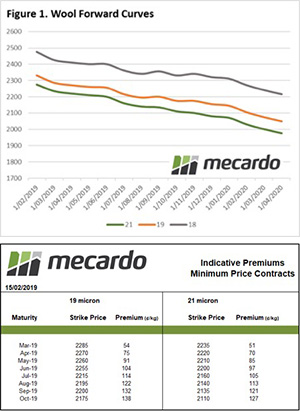
The Eastern Market Indicator (EMI) ended the first day of sales flat, but increased 10 cents on the second day of selling, finishing the week at 1,944 cents. Last week’s Au$ rally came tumbling down this week, to 0.709 US cents. This saw the EMI take a harsh turn in US$ terms to close 25 cents lower at 1,380 cents (Table 1).

The market in the West showed much the same sense as in the East. The Western Market Indicator (WMI) gained 7 cents on the week to 2,101 cents.

The week saw a total offering of 39,894 bales come to market, with 7% passed in. This resulted in a clearance to the trade of 37,092 bales. The season to date has seen 992,742 bales offered which is short 176,735 bales compared to this point in the 17/18 season.

The dollar value for the week was $77.25 million, for a combined value of $1.97 billion so far this season.

Nearly all individual MPG’s saw gains in each selling centre this week. The only category to have taken a hit was fine wools in the South, which saw losses in the range of 5 to 25 cents. Fine wools in the North were a different story. Holding its first designated Superfine sale for 2019, the Northern region saw 16.5 to 18 micron wools lift 40 to 45 cents higher on the week, having received strong support for the event.

The Crossbred market continued its strong performance. 28 to 30 MPG’s were the most keenly sought after, with gains of 20 to 40 cents. Merino skirtings held firm across the centres, with limited offerings. The cardings indicators dropped back slightly in the East this week, while remained unchanged in the West.

The week ahead

Next week 39,520 bales are rostered for sale across the three centres on Wednesday and Thursday. This is only slightly reduced on this week’s volumes; however, a trend of declining supply is forecast. 38,205 and 35,275 bales are rostered for weeks 34 and 35 of the selling season respectively.
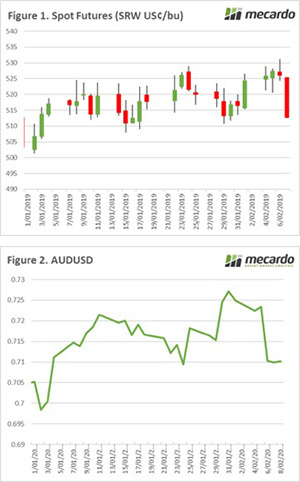
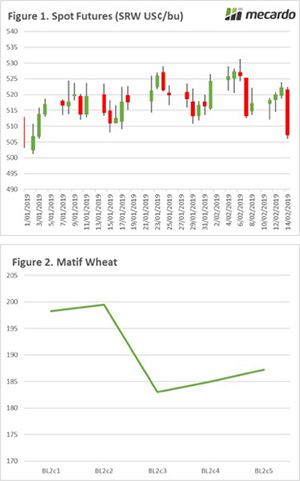
Price action suggests a rebound in supply

The dip in lamb and sheep supply after last weeks shortened selling program was evident in throughput levels reported to Friday 1st of February. Lamb and sheep prices have continued to ease this week, suggesting that saleyard volumes have rebounded.

The Eastern States Trade Lamb Indicator (ESLTI) softened 4.6% this week to close at 633¢/kg cwt. East coast mutton was under pressure too, easing 7.6% to 368¢. Mutton prices across the Eastern seaboard have succumbed to elevated sheep slaughter volumes, with particularly high cull levels noted out of Victoria over the last month (Figure 1).

Victorian mutton slaughter has been running at weekly levels 24% higher than the five-year average since the start of 2019 and the increased volumes have continued to weigh on Victorian mutton prices with a 10¢ drop reported across Victorian saleyards according to the mid-week MLA market report. Victorian mutton is not the cheapest in the country though, at 378¢ it is still faring better than SA. SA mutton has dragged the chain, dropping 44¢ to 322¢ to make it the cheapest mutton in the nation.

East coast sheep yarding levels (as at Friday 1st February) are reflecting the shorter selling week with a 29% drop noted from the prior week’s figures to see just shy of 59,000 head change hands. The 2019 pattern is closely mirroring the five-year seasonal average trend and if this is any indication of what to expect for sheep yarding figures when MLA report them next Wednesday, we could see sheep yardings rebound toward the 85,000 head level (Figure 2).

A similar yarding pattern is emerging for East coast lamb with the 2019 trend also mirroring the five-year average (Figure 3). Lamb throughput (as at 1st February) declined 13% from the previous week to see it a whisker away from the seasonal average at around 138,000 head. Assuming lamb follows the seasonal average, we can expect to see a jump toward 190,000 reported for this week. Indeed, the price action suggests that supply has rebounded.

What does it mean/next week?:

Monsoonal conditions in northern Queensland have spun off a bit of moisture into the bottom South East quarter of the nation this week and a little more is forecast to fall into the coming week. While it isn’t enough to get lamb and sheep prices booming it’s likely to put a floor under further easing in the coming weeks.

What will northern rain do to the market?

There have been floods in Townsville and massive rains across large swathes of Northern cattle country. There has, however, been no relief for much of the Murray Darling Basin. The wash-up, so to speak, was a little bit of support for cattle prices this week.

The Meat and Livestock Australia (MLA) cattle distribution map gives some food for thought (Link here). At June 30 in 2017 the areas which have been most wet accounted for 4.5 million head, or 17% of the National Herd.

While these regions are a long way from the slaughter markets we usually look at, cattle do flow south and so transport issues and the potential for grass growth could impact supplies to processors in Southern Queensland.

The Eastern Young Cattle Indicator (EYCI) only managed a marginal lift, gaining 6¢ to 478.5¢/g cwt, but prices in Queensland did make a bit of a move. The Queensland Heavy Steer Indicator gained 32¢ to 582¢/kg cwt (Figure 3), while Cows were up 26¢ to 426¢/kg cwt. Both are well above the same time last year when the EYCI is sitting at a 60¢ discount.

The Live Export prices out of Townsville were quoted at 290¢/kg lwt this week, at a discount to Darwin at 325¢. These prices are around the same as what is available from lotfeeders further south, so its unlikely many were heading that way. With the rain, there might be some now being drawn north, which should offer price support.

Down for the count?

The grain trade awaits the release of backlogged data from the USDA which will be broadcast this evening (8th February 2019)

The spot Chicago futures contract after posting gains in the post superbowl trading days, has been hit with an almighty hammer overnight. The future contract declined by A$6 overnight (Figure 1).

The fall in prices was due to a combination of factors (as tends to always be the case), the main ones being the expectation that XI-Trump trade talks are not as jovial as previously anticipated.

Another reason in the sharp overnight correction is due to the imminent release of backlogged data by the USDA.  The data released tonight will be the first information from the USDA since mid-December. Will this create fireworks or will it fizzle out?

The RBA have changed their tune on interest rates. In the past year the commentary was of a likely interest rate rise, however this week they are pointing towards potential interest rate falls. The impact of these statements was felt in the currency market with the AUD falling to 71¢ (Figure 2).

This is the second major crash in the AUD since the start of the year. After the last crash the market recovered shortly afterwards, the question will be – is the AUD down for the count or like Tyson Fury will it regain its legs?

A reduced local currency will help with exports. On the flipside however it will increase the cost of imported products such as fuel and fertilizer.

Due to an unexpected error, the Mecardo website has lost some functionality. We are currently working day and night to resolve the issue.

What does it mean/next week?:

The market will be chewing through the data releases from the USDA overnight, which will give the market its direction over the coming week.

The Baltic Dry Index has capsized

Australia is a net exporter of grains, most of which will make its way out of the continent on bulk vessels. Grains are undifferentiated commodities with largely no difference between origins, therefore the cost of logistics becomes a primary driver of competitiveness. In this article we dive into the Baltic Dry Index and its impact on markets.

So what is the Baltic Dry Index (BDI)? The BDI is an index which tracks the cost of bulk shipping around the world. The index is calculated on a daily basis and covers twenty typical routes using three vessel types (Capesize, Panamax and Supramax.) This gives an indication of the trend in price movement, and provides an insight into how much it will cost to transport bulk commodities i.e. a lower BDI would indicate reduced freight costs.

This is important for Australian producers as we typically export the majority of our grain and oilseed production. A low freight rate therefore reduces the benefit of geographical advantage.

The BDI has a secondary function. It is considered by many to be a leading economic indicator. The cargoes typically transported by bulk vessels are commodities requiring further processing (iron ore, coal, grains etc) to create a product. This gives a potential indication of future economic growth, as the demand for raw commodities such as iron ore will increase as economies grow.


So why are we talking about it? The BDI has submerged (pardon the pun) in recent weeks. In figure 1, the daily change in the BDI is displayed since the start of December. The last positive move was on the 8th of January. This has resulted in a 50.5% fall in the index since the start of January.

It is not however wholly unexpected to see a fall in the BDI, as seasonal trends do tend to show a dip in the first two months of the year (figure 2). The index currently sits at 634, which is a low level albeit within the range which has been experienced during this decade.

So why has it fallen? There are several theories as to why the BDI has capsized, and a combination of all are likely to have had an impact:

  • The Vale dam collapse in Brazil which has led to the loss of 134 lives has resulted in up to forty million tonnes of iron ore being removed from the market, as Vale decommissions similar facilities.
  • The Chinese economy looks to be taking a turn for the worse with the Caixin manufacturing purchasing managers index falling below expectations signaling a deterioration in the manufacturing sector.
  • Seasonal slow down ahead of the Chinese lunar new year.
  • Continued overcapacity of bulk vessels and mismatches of vessel sizes.

What does it mean/next week?:

If the sharp decline in the BDI endures, this does not bode well for global economies – especially China. The Australian economy is heavily reliant upon China as a trading partner, and any fall in their buying power will have an impact on many of our commodities and food products.

The fall in the index along with poor economic data emerging in China may spur a quick resolution by the Chinese delegation in the Trump tariff talks.

The fall in the BDI does not mean that grain prices will fall, however it does mean that traditional trade flows become less important as shipping costs fall.

Key Points

  • The BDI is an indicator of the cost of bulk shipping rates, but also holds a secondary function as a primary economic indicator.
  • The BDI has keeled over, sinking to the depths of 634 from 1282 at the start of January.
  • The sudden fall could point towards a coming slowdown in the global economy.

Plan for the worst; hope for the best (in the west).

In this update I take a look at the most recent BOM three month climate outlook. What does it mean for the 2019/20 crop? In other news there could be some excitement on the market as the USDA start releasing data after a >1 month hiatus, and the Chinese-US negotiations comes to a head.

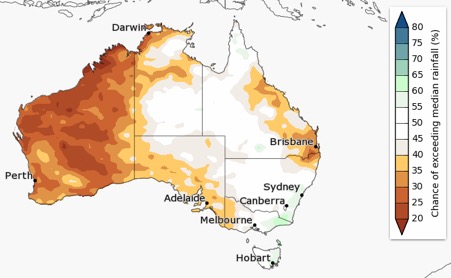
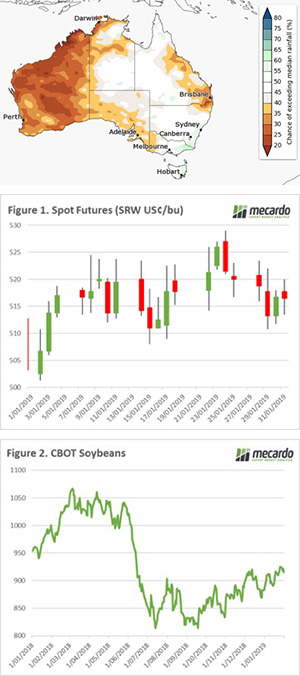
The bureau of meteorology has released its three month climate outlook. It doesn’t look good for Queensland and the West. After a fantastic year where WA produced a 17.5mmt crop, pre season rainfall has a limited chance of exceeding the median. This will put a dampener on expectations for the coming season. However, I have a few thoughts when it comes to this projection:

1. Weather projections can be highly volatile, and this may not be realized.

  1. Although subsoil moisture prior to planting is very welcome, it doesn’t make the crop.

There are a range of factors that will determine the development of the 2019/20 crop, however on the 1st of February it is far to early to judge the end result. It is always best to ‘plan for the worst, hope for the best’.

The futures market lost ground this week with spot futures back A$5 (figure 1). The market has remained subdued whilst awaiting fresh data releases by the USDA. I covered the lack of volatility and volume in late last week (see here) and on the reaction to USDA releases (see here). The release of new data after such a long hiatus could lead to increased levels of volatility, if there are any major surprises that private forecasters had not expected.

The big news to watch over the next week will be whether Trump and Xi can reach a middle ground to reduce the tensions between the two giants of trade. There looks to be some thawing of the relationship as China has agreed to purchase 5mmt of Soybeans. If you have been paying attention to my updates over the past year that soybeans have been at the centre of the trade tariffs which have resulted in US soybeans falling (and Brazilian sources rising).

As the two nations commenced negotiations the market has been quietly confident of a amicable solution being found. This has seen the market start to gain ground (figure 2), as the market opens with news of a 5mmt will we see a sharp upward trajectory?

What does it mean/next week?:
We could be in for a wild ride over the next week as the market reacts to the release of USDA data and US-China trade negotiations.