Category: Business

A great start to your 2020 grain marketing

The price received in Australia is composed of futures & basis*. It is possible to lock in the futures component through using derivatives (swap/futures etc).

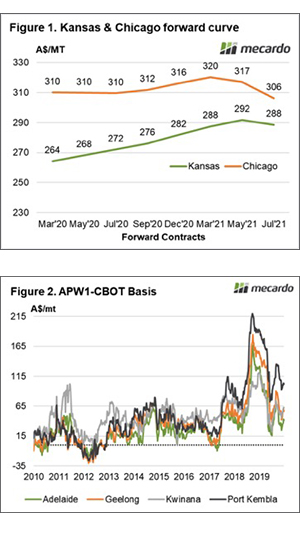
In figure 1 the forward curve is displayed in A$/mt. The forward curve shows the futures price for forward contract months.

The December 2020 contract which aligns with the Australian harvest is currently trading at A$316/mt. This is the highest level in five years, and provides a strong starting point for marketing grain.

As mentioned before the futures price is one component albeit one which makes up the majority of price (even in drought years – see here).

If using swaps/futures, the final price you receive will effectively be your futures price (A$316) plus basis at the point of physical sale.

In figure 2 the weekly average basis is displayed since 2010. As we can see the past year and a half is probably not a reliable indicator due to the drought led basis. However, the average across the country is:

  • Adelaide A$28
  • Geelong A$37
  • Kwinana A$49
  • Port Kembla A$51
  • Port Lincoln A$24

On the law of averages locking in futures and selling on average basis would return between A$340 & A$366. A price that is historically attractive.

*For the purpose of this analysis we are not including FX, and basing on a converted futures price.

Remember to listen to the  Commodity Conversation podcast by Mecardo

What does it mean/next week?:

The futures market is currently offering strong levels for December 2020. A large proportion of the rise in recent weeks has been due to geopolitical factors – which could lead to volatility.

At present these are high levels compared to the last five years. If you lock in a little at these levels, and it turns out to be the worst trade you do – it is still likely to be profitable.

Little and often wins the day.

Have you (ever) seen the rain?

“Someone told me long ago. There’s a calm before the storm. I know it’s been comin’ for some time” and it arrived this week with some excellent rainfall to many areas in need. Combined with an improved three-month outlook from the Bureau of Meteorology (BOM) it helped give cattle markets a lift for the first trading week of 2020.

Social media abounded with images of water flowing across previously parched grounds and filling dams, not to mention aiding firefighters in fire-affected areas. Falls up to 50 mm were reported in places that hadn’t seen rain for a long time, particularly through northern NSW and Western Queensland.

The good news is that it isn’t over yet, as Figure 1 highlights, there is more in store for the coming week across the eastern seaboard. Cattle markets responded well to the news with modest gains of 5¢ to 45¢/kg lwt across most cattle types throughout the eastern states.

On the MLA reported national indicator cattle categories yearling steers purchased by restockers showed the strongest gains on the week, up 22.5¢ to 265.6¢/kg lwt. Medium cow also managed a strong showing with a 21.1¢ lift to finish at 205.3¢/kg lwt. The Eastern Young Cattle Indicator (EYCI) mirroring the broader market to see a 38¢ lift over the week, closing at 515.5¢/kg cwt – Figure 2.

As we pointed out in our analysis earlier this week the 90CL manufactured beef export price to the US has eased significantly from its 2019 peak, but thankfully the weather trumped the international beef market moves. Furthermore, there is still a huge gap for the EYCI to make up should climatic conditions remain favorable for an extended period and begin to encourage restockers back into the market in a serious manner.

Next week

The mid-month BOM rainfall forecast release shows there is some hope for the first quarter of 2020 with much of the country showing a 50/50 chance of a wetter or drier than average outcome – Figure 3. I know a 50/50 chance isn’t too much to get excited by just yet, but it is the most positive long-range forecast we have seen in some time.

The BOM suggests that the two key factors that had been keeping moisture away from the continent (a positive Indian Ocean Dipole and a negative Southern Annular mode) are now breaking down, allowing an improved chance of rainfall events occurring. Certainly, the week ahead is looking promising and this should give credence to a continued revival in cattle markets in the short term.

It’s a deal, it’s a steal, it’s the sale of the century

A welcome sound not heard for a long time is being heard throughout large parts of NSW & QLD. The noise of raindrops hitting roofs. This week we cover a few factors from overseas impacting on markets including Egyptian purchases, Russian intervention, and the phase 1 deal.

In recent months weather forecasts have consistently tantalized without providing much (see map). Last week strong rainfall was forecast for large parts of the country, and like the boy who cried wolf – I didn’t believe the forecasts. As time flowed this one seemed to be coming to fruition, but I had been tricked into a false sense of security before.

To my delight, this one has delivered for many. Although this rainfall event would have been more welcome four weeks ago for the summer crop, it has provided a good dump of rain throughout the drought-ridden east coast. Let’s not get too cocky though, we’ll need a little more rain to guarantee a good 2020 crop.

Let’s start with the global market. At the end of last week, the Chicago futures market rallied as Egypt bought 300kmt of wheat, at the highest price since February. This volume was unsurprisingly black sea origin however provided a bullish sentiment for overall pricing.

Russia also assisted with the price rise by intervening in their markets. A new export quota limiting grain exports to 20mmt for the first half of the year was enacted. This caused some concern as interventions by what is now the world’s most important grain exporter could have ramifications for trade flows.

Relations between China and the US seemed to be thawing this week, as both countries agreed to a phase 1 trade deal. This deal is a starting point in improving trade between the two super powers, including the agreement to purchase an increased value in agricultural produce over the next two years.

In the agreement China are set to purchase $36.5bn (A$52bn) in 2020, and $43.5bn(A$63bn) in 2021. To put the scale of the increase in perspective during 2017 China purchased $24bn (A$35bn) in agricultural produce from the US (figure 2).

There is a lot of conjecture at present related to which commodities China will purchase in order to increase their value purchased.

The trade wasn’t overly impressed by the deal as it didn’t contain much detail in regards to products purchased, and included a market value clause:

‘The Parties acknowledge that purchases will be made at market prices based on commercial considerations and that market conditions, particularly in the case of agricultural goods, may dictate the timing of purchases within any given year.’

The big concern for me is that in order to meet these purchase requirements is that the trade flows may prioritise US as an origin for many agricultural commodities.

Remember to listen to the  Commodity Conversation podcast by Mecardo

What does it mean/next week?:

The rain is set to continue through many parts which will provide some confidence for the coming crop. This must be tempered by the reality of it being four months until seeding and nine months from harvest.

Roll up, roll up for the wheat rollercoaster

Up, down, side to side. The rollercoaster of the grain market continues to provide excitement. As harvest advances pricing levels have risen. In this week’s update we take a look at ASX pricing, WA forecasts, Trump deals, and UK elections.


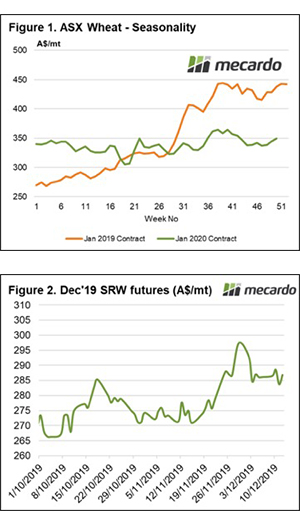
The ASX contract has risen dramatically during the past week, at the end of last week the December 2020 was trading at a weekly average of A$344 and has now moved up to A$349 (figure 1). There are concerns from feed consumers related to the slow pace of harvest in Victoria, which is driven both physical and futures levels higher.

The ASX swaps offered by banks are expiring during the next week, and we can clearly see that there are contracts being rolled from the January contract to May. This allows consumers to maintain cover for this season without having to convert to physical.

The Grain Industry Association of Western Australia released its updated crop forecasts. After a strong crop last year the crop has disappointed this season. The production estimates and month on month change are shown below:

  • Wheat 5.4mmt (-8%)
  • Barley 3.9mmt (+5.3%)
  • Canola 1.1mmt (+13.5%)
  • Oats 400kmt (-13.2%)

The GIWA results in the past have been generally quite accurate, however, after discussing with contacts in the west, these numbers have room for further downward revisions.

On an international level, we have seen US futures trading downward for most of this week, but we have seen a large rise overnight. This has been driven by comments from Trump related to positive trade talks with China.

It’s a bit like groundhog day now, where China and US get close to a resolution only for a last-minute pull back. At present, a limited agreement is on the cards which will prevent the new tariffs due to be implemented on Sunday.

This has driven the markets higher as the prospect of trade flows returning to normal. I believe that it will be a while until trade with China is back to normal and that these negotiations will likely continue for some time.

The UK went to the polls yesterday for the 3rd time in the past five years. The election has been one of the most contentious in recent years due to Brexit, with one side calling for further referendums and the other to get the deal done. The previous parliament was unable to reach agreements on the Brexit package after numerous votes, resulting in the current election.

As the voting booths close the exit polls are predicting a very strong conservative majority. If this eventuates, we will see a strong rally in the GBP.

Remember to listen to the  Commodity Conversation podcast by Mecardo

What does it mean? – Next week:

Feed demand remains strong at present with buyers looking to fulfill uncovered feeding requirements. This has provided a beneficial jump in values for producers. Whether this continues when grower selling increases is yet to be determined.

The record cow values didn’t last long

Just a month ago Cow prices were over 500¢, and almost the same price as the Eastern Young Cattle Indicator (EYCI).  This week cow prices continued to tank, while other cattle types largely held their ground.

Figure 1 shows state cattle indicators declining sharply since hitting a peak five weeks ago.  This week the Queensland Cow indicator fell a further 22¢ to hit a six month low. Dire weather conditions and another uninspiring forecast has seen cattle continue to move into the market.

Cattle slaughter hit another peak last week, moving to new highs not seen since 2015 (figure 2).  Yardings were lower last week on the back of the lower prices, but they are still very strong for this time of year.  This combined with plenty going direct, means processors don’t need to bid up at saleyards for supply.

Adding further price pressure was falling 90CL export prices.  After peaking at 968¢ two weeks ago, the 90CL has fallen 40¢, but figure 3 shows it is still way above historical levels.  The falls were largely due to buyers taking a break after Thanksgiving, but Steiner report there was little business done.

In WA cattle prices moved in opposite directions for young and old cattle.  The Western Young Cattle Indicator (WYCI) fell 37¢ to still a quite respectable 527¢/kg cwt.  Cow prices in the west were up 8¢, to 207¢/kg lwt.  Cows in the west are now at a premium to the east coast.

Next week

There is no rain on the forecast leading up to Christmas, which isn’t great news for prices.  We often see a large shift in cattle prices between years, as it either rains or it doesn’t.  Good northern rain would obviously see a strong move upwards, but forecasts don’t look promising.

Cattle supply overcoming export demand

There have been no real movements in strong export beef prices in recent weeks, but cattle prices have been on the decline in saleyards.  It seems slaughter capacity might have been reached, and with processors booked up until Christmas, demand at saleyards is on the wane.

As we move into December the season definitely hasn’t improved in a lot of areas, and the cattle keep flowing.  Cattle slaughter reached a six month high a fortnight ago and is still bumping up against four-year highs.

Figure 1 shows the last time cattle slaughter was this consistently strong on the east coast was in 2015.  Interestingly, the EYCI at this time in 2015 was 600¢, showing the difference restocker demand can make.  Heavy steer and cow prices were similar to what we are seeing now, but margins for processors were much tighter.

We can see in figure 2 that at the end of 2015 the EYCI and 90CL Frozen Cow were priced around the same level.  Now the 90CL is at a 450¢ premium, not quite double the EYCI.

Slaughter capacity has been up to 11% higher in the past, but processors are no doubt reluctant to invest in opening up more kill space given the declining herd.  A good rain will see the supply of all cattle types tighten, and would mean processors would face the costs of closing down the extra space.

Cattle prices were down across the board last week, with declines between 10 and 30¢/kg cwt.  This might see supply tighten, and have growers waiting until the New Year.

Next Week:

There is yet again no rain on the forecast, and the outlook remains bleak for the next three months (figure 3).  It doesn’t mean it can’t rain, but it is still more likely to be dry.  Cattle can’t keep coming forever, and it is likely we’ll see things tighten and prices steady in January.

Beef exports down but China still rising

Beef export figures for November are out, and we are getting a picture as to why export prices have been running rampant. While the total supply of beef for exports declined in November, it didn’t stop China from posting yet another record import level. 

Cattle slaughter was still relatively strong in November, so it is likely the cattle were lighter.  November beef exports were down 9% in October, but up 9% in November 2018.  In fact, November exports have only ever been higher once, in 2014.

Declining export volume didn’t stop China from taking yet another record amount. Figure 2 shows China was easily the biggest market for Australian beef, taking 33%. The comparison numbers again show rapid growth. The 34.2 million tonnes exported to China (figure 2) was up 12% in October and 134% in November last year.

With 90% of the beef exported to China being frozen, it is pulling more and more beef away from the US. Figure 3 shows declining US exports, with November being down 37% on last month and 14% on last year. Exports in November were also the lowest for that month since 2016, when total supplies were much tighter.

The US share of exports was 26% back in November 2016, and just 13% last month. This share was the lowest since 2010. There is not a glut of beef in the US, they are still very much chasing our exports. It seems that China simply has more money for beef at the moment.

Japan and South Korea managed to maintain their share of our beef exports, but in general, they are after more expensive cuts of beef.  With manufacturing beef prices still rising, there might be some better cuts going through the grinder.

What does this mean?

We’ve been following the rising 90CL beef prices over the last month and the rally in price fits nicely with export flows. The reports of US buyers scrambling for beef in a rising price environment shows up in much more beef going to China and much less to the US.

The market is still waiting for Chinese beef demand to flatten out, and see some sort of equilibrium reached in export markets. At present, however, things are still highly uncertain.

Live cattle flow on the up

The October release of LiveCorp live export cattle flow shows a steady gain in volumes since August. This analysis piece looks at the breakdown of the trade with a focus recent changes to the flow to key export destinations and ports of exit.

The monthly flow of live cattle has reached its highest point this season in October at 117,511 head, mirroring a similar magnitude surge during October of 2018 (Figure 1). This places live cattle export volumes 21% above the five-year seasonal average trend for October.

Fueling the increased flow of Australian live cattle exports in recent months has been a resurgence in demand from Vietnam between August to October. Indeed, for the August to October period, the flow of Australian live cattle to Vietnam has averaged a 69% increase in the five-year seasonal pattern (Figure 2). In contrast, Australia’s largest live cattle trade partner, Indonesia, has demonstrated 10% higher flows over the same timeframe.

The changing dynamic of the live cattle trade isn’t just limited to destination points. Similarly, there has been a noticeable change in exits ports from Australia in recent years. Townsville has seen a steady rise in live cattle departures, pushing Queensland’s market share of departures from 24% in 2018 to 27% in 2019. Although, this has come at the expense of ports in the remaining key live cattle export states of the Northern Territory (NT) and Western Australia, down from 37% to 31% and from 21% to 19%, respectively (Figure 3).

Historically there has been a preference for live cattle exports from the NT to favour an Indonesian destination when assessing on both a volume and percentage of trade basis. Whereas flows out of Queensland favour Indonesia on a volume basis but is heavily geared towards Vietnam when comparing it by the percentage of total trade to each destination.

In the last five years (2014-2018), the volume of live cattle from the NT to Indonesia has averaged nearer 300,000 head per year, compared to 60,000 head into Vietnam. This equates to 55% and 30% of the total Australian live cattle trade flow to Indonesia and Vietnam, respectively.

During 2014-2018, Queensland has averaged 140,000 head to Indonesia and 89,000 to Vietnam. This equates to 26% and 43% of the total Australian live cattle trade flow to Indonesia and Vietnam, respectively.

What does it mean?

Given that Indonesia takes the lion’s share of Australian live cattle exports it is unsurprising that on a volume basis it is an important destination point for all export ports in the north of Australia. However, the importance of Vietnam as a key destination point for Queensland based cattle departures cannot be underestimated.

Certainly, the recent growth in Vietnamese demand for live cattle has underpinned the resurgence in flows from the port of Townsville. Indeed, average monthly flows from Queensland during the August to October period are running 147% above the five-year trend.

Record spring yardings dampening prices

Cattle prices continued to ease this week in the face of more rises in export markets. There is little doubting the driver behind lower saleyard prices, with the season yet to break and relatively strong prices drawing out supply.

It’s always about supply and demand. In the last couple of weeks, it has been increasing supply overwhelming strong demand. Figure 1 shows east coast cattle yardings hit 80,000 head last week.  Cattle yardings have only been this high once this year, back in April.

In fact, cattle yardings have never gone over 80,000 head in the spring. The numbers are quite remarkable given the declining herd, but strong prices and little feed are pushing cattle into yards.  No surprises that NSW and Queensland are leading the strong yardings, both up 31% and 68% on last year respectively.

With the heavy supply, it is improving demand, from the more increases in export prices, which is stopping cattle prices from really tanking. The Eastern Young Cattle Indicator (EYCI) lost another 10¢ this week to hit a five-week low of 504¢/kg cwt (Figure 2).

Heavier cattle categories took more of a hit. The National Heavy Steer and Medium Cow Indicators fell 47¢ and 48¢ respectively. Having hit 3-year highs recently, supplies are likely to have picked up in saleyards as growers try to take advantage of the highs.

The 90CL Frozen Cow indicator gained another 12¢ in our terms to post yet another record of 972¢/kg cwt.  In US terms, it hit the magic 300¢/lb, surpassing the September 2014 record. Never has cow beef been more expensive in the US, at least in nominal terms.

Next Week:

There has been a bit of precipitation about this week and there’s a bit more on the forecast. Given the much lower prices this week, we might expect as sharp a pullback in supply and steadier prices.  Some rain would obviously help find support and there should be some upside.

ASF pressure sees EYCI-90CL spread to widest discount

US-based consultants Steiner, published by Meat and Livestock Australia, report a surge in the 90CL imported beef export price as panic buying sets in under strong African Swine Fever (ASF) induced demand pressure. Despite the big leap forward in the 90CL, domestic Australian cattle values softened across the board this week as the poor outlook for rainfall continues to bite.

The 90CL imported beef export price jumped 14% from 840¢ to 960¢ as both US and Chinese buyers fight it out for access to Australian and New Zealand manufactured beef products (Figure 1). This price point is well and truly into record territory for the 90CL and it pushes the spread between the Eastern Young Cattle Indicator (EYCI) and the 90CL to a record discount, on a cent per kilo basis.

Figure 2 outlines the historical spread between the EYCI and the 90CL in both ¢/kg and percentage terms. The sharp rally in the 90CL puts the discount at 443¢/kg, the widest it has ever been. Indeed, it was back in November 2014 that we saw the discount between the EYCI and the 90CL at anywhere near the current level when it blew out to a 351¢ discount spread during the midst of Australia’s last significant drought event.

However. a more accurate reflection of the magnitude of the discount spread is to measure the gap between the EYCI and 90CLl in percentage terms (as shown by the grey line on Figure 2). The current percentage discount spread has widened significantly to 46.1% but is yet to reach the record 51.6% discount recorded during November 2014.

Young cattle prices within Australia failed to respond kindly to the surging export market with the EYCI easing 4.25¢ to close at 512.75¢/kg cwt. A sentiment mirrored across all MLA reported categories of cattle across the eastern states this week with price drops ranging from 1.5¢ for Yearling Steer to 21¢ for Medium Cow.

Next week

Hampering the ability for domestic Australian prices to fully benefit from the rampant offshore demand for beef continues to be the poor outlook for rainfall in the coming month (Figure 3).

An expected delay to the northern monsoon season continues to see Queensland suffer under a very low expectation of exceeding normal rainfall levels for this time in the year, and this is particularly true for the far northern regions.