Category: Market Analysis

US China trade deal – abridged

Mid-January saw China and the USA sign off on phase one of a new trade deal, using pre-trade war volumes from 2017 as a benchmark for expansion in trade volumes. While it is still early days in the negotiation a key aim of the Trump administration is to get China to import more US agricultural products, with US beef and pig farmers excited by this prospect.

As part of the broader deal, China has agreed to increase purchases of US agricultural products with an aim to hit $US43 billion in trade value by 2021. In 2017 China imported less than $US25 billion of US agricultural products – the bulk of which was soybean to feed their huge pig inventory.

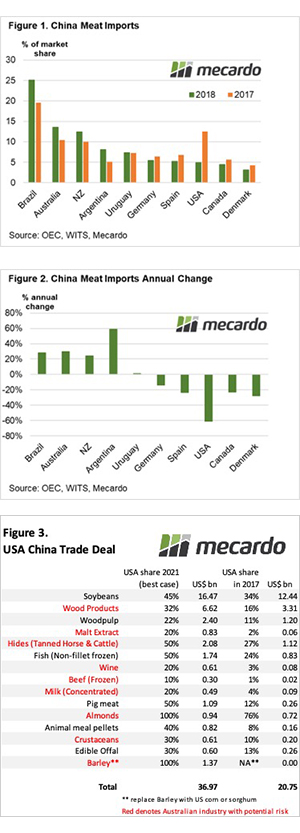
In terms of meat imports into China from the US the beef industry never really gained a foothold, with the US holding less than 1% of the market share of Chinese beef imports in 2017. US pork producers had a far better penetration with 12% of Chinese pork imports in 2017.

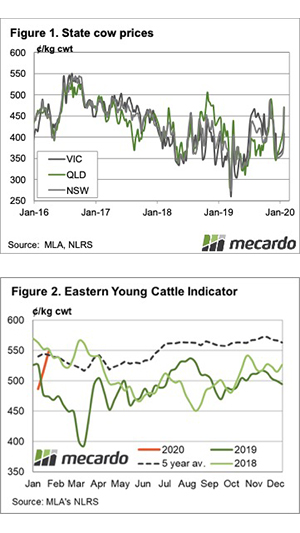
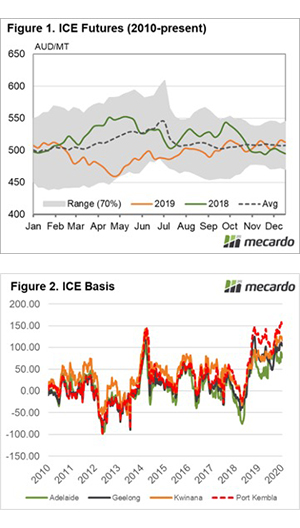
A comparison of meat imports into China (of all types of meat except fish/seafood) during the 2017-2018 period shows that US market share declined significantly compared to other key trading nations from 12.5% to 4.9%, due to the increase of tariffs imposed by China and growing trade hostilities – Figure 1.

The US market share of Chinese meat imports dropped by 60%. In contrast, Argentina captured nearly 60% more market share, while Brazil, Australia, and NZ all saw their market share increase by over 20% during the 2017 to 2018 period – Figure 2.

To hit the $US43 billion target in two years’ time there would need to be a significant shift in trade flows into China, with a clear preference for US product. In terms of pork and sheepmeat, this isn’t a huge direct competition for Australian producers as Australia doesn’t export significant volumes of pork to China and the US don’t really have a sheep/lamb export presence on an international level.

Historically, there have been a few barriers to entry into China for US beef producers, namely the lack of traceability and concerns around the use of hormone growth promotants. However, part of the trade negotiations agreed to this month was seeking to address these barriers and open a clearer path for US beef into China.

Remember to look out for our upcoming podcast delving further into this topic, including an assessment of the impact across a variety of Australian agricultural sectors – Figure 3. It is still in the recording studio at present, but you will be able to find the podcast by clicking the link to “Commodity Conversations” after Australia day.

What does it mean/next week?

Matters of trade are highly complex situations with many moving parts. Addressing the implications for the Australian agricultural sector of this new trade deal between the US and China is a topic too broad for a standard Mecardo analysis piece, but we will be discussing it at length in our podcast series entitled “Commodity Conversations”.

The abridged summary of our thoughts in relation to the impact on Australian sheepmeat and pork producers is that it is limited. In terms of the impact on our beef sector, the jury is out when assessing over the longer term. But in the short term, we don’t see any immediate risk to Australian beef flows into China from the US during 2020.

Rain and low supply provide a welcome boost

Welcome rain across the eastern seaboard this week provided a jolt to lamb prices with most NLRS reported categories posting solid gains of between 20-60¢/kg on a cwt basis. The expected lower supply of lamb for the 2020 season already making a presence in lower weekly slaughter volumes and adding further support to lamb prices.

Figure 1 highlights the rainfall pattern for the last week and shows some good falls recorded across eastern NSW and Victoria. Western NSW and SA could have done with some more, but at least the Bureau of Meteorology’s three-month rainfall outlook is looking more promising for a decent autumn break for producers in these regions.

East coast weekly lamb slaughter volumes have opened the season below the five-year trend and is running at levels under the 2019 trend for early January – Figure 2. Over the first fortnight of 2020 lamb slaughter volumes are averaging 5% weaker than the five-year pattern with just over 360,000 head processed on average per week.

The lower lamb supply is also showing up in the east coast lamb yarding numbers with last week’s figures coming in 12% below the five-year pattern. Given the level of reduction in breeding ewes last season and the dip in the sheep flock to lows unseen in a century it is unsurprising that we are witnessing a dearth of lambs early in 2020.

The Eastern States Trade Lamb Indicator (ESTLI) responding well to the rain and shortage in supply to see a 5.5% lift on the week to close at 779¢/kg cwt. The National Mutton Indicator (NMI) posting a more modest 2.7% gain to 576¢/kg cwt – Figure 3.

Next week:

More rain is expected for the northeast corner of NSW in the coming week, but little else for the bulk of the remaining sheep rearing regions across the country. Some huge falls are anticipated for northern Queensland and could signal the beginnings of the summer monsoon pattern. With some luck, some of this moisture will carry south into areas of SA and western NSW that are still in need.

In the interim, there has probably been enough rain in the last few weeks to see lamb and sheep prices remain supported over the short term.

Cardings defy downward trend

The impressive opening to the 2020 selling season, pronounced by three successive weeks of rises, has hit a roadhump as the Australian wool market has recorded overall losses this week. The fragility of the market was clearly evident as prices changed day to day, sometimes up and other times down. A softer tone was evident as soon as selling began, with the market settling on the final selling day as buyers found a price basis they were comfortable with.

The Eastern Market Indicator (EMI) fell every day except Thursday and closed down 33 cents at 1,576 cents, a massive differential to this week last year when it reached 1,927 cents. The AU$ saw some very minor corrections over the week and now sits around the middle of US $.68 and $.69 cents. In US terms, this moved the EMI down 29 cents to 1,082 cents.

The Western Market Indicator (WMI) also eased slightly to finish the week 1,685 cents. As evident in Sydney & Melbourne, WA prices were up and down over the course of the week, with an overall downward trend as buyers wrestled to find a price they could stomach.

The national offering was very similar to last week, a total of 52,666 bales came forward, elevated as expected for January. The pass in rate increased to the mid-teens of 15.9% nationally. This meant that 44,273 bales were cleared to the trade, a top 3 performance since January 2019.

The dollar value for the week was $75.15 million, while the combined value so far this season is just under $1.215 billion.

The crossbred types saw the same fate as the other MPGs, with prices yo-yoing across the week. Oddments defied the general trend, however, propelled by a demand in locks, pushing Cardings indicators up by an average of 30 cents.

The week ahead

With the stabilization of the market on Thursday and a lower offering pegged for next week, it is possible the market has found a short-term base. How much prices fluctuate will depend somewhat on buyer confidence, so it will be important to watch for portents and omens in the Lunar New Year.

The offering posted for next week is significantly lower at 40,680 bales and the following week is a designated superfine sale.

Cows the star but EYCI at 22 month highs

We haven’t seen an early January price rise for a few years, largely due to a lack of summer rain. This year we’ve seen store and cow markets lift in early sales as rain tightens supply and bolsters demand.

It is no secret that female cattle will be in hot demand if the rain seen over the last week continues.  Export beef prices have eased but they are still well above this time last year, and when processors have to compete with restockers, markets rally.

Figure 1 shows NSW and Queensland Cows have moved back towards November highs this week.  Cows are the star performers, gaining over 30% from the December close. Victoria is lagging behind a bit, at 408¢ this week, but they will no doubt join other states in the coming weeks.

The Eastern Young Cattle Indicator (EYCI) has also rallied strongly, gaining 13%, but importantly hitting its highest price since March 2018 (figure 2).  It is also the first time the EYCI has been higher than the five year average since early 2018.  The rain is making cattle bought at the southern weaner sales look cheap at the moment.

The 90CL Frozen Cow export beef price continued to ease this week, now sitting at 708¢/kg cwt.  It will be interesting to see of the 90CL can continue to fall, especially if cow prices keep rising and margin pressure comes on processors.

Over in the West, the Western Young Cattle Indicator (WYCI) has moved below the EYCI, a rare thing in recent years.  The wet weather in WA should see the WYCI find some support around the current 526¢/kg cwt level

Next Week:

For most of last year, we were looking at no rain for the week just gone, and none coming up.  This week the widespread rain is forecast to be repeated over the coming eight days, providing more impetus for markets.

At some stage, heavy cattle prices should start to follow young cattle, as fewer cattle make their way to processors.

Are you on ICE?

The canola market has seen a surge in pricing levels since harvest commence. This has been beneficial to producers who generally wait until harvest before selling their canola. In this update, we take a look at the basis between ICE canola futures and local pricing.

There are two main canola futures contracts ICE (Canadian canola) and Matif (French rapeseed), in this update we will be taking a look at the basis between ICE and Australian pricing levels.

Canada is an important canola producer, with the country producing on average 28% of the world’s canola crop over the past five years. Most of the canola grown in Canada is genetically modified, whereas the majority of the Australian canola crop is non-gm.

In a typical year Australia will export the majority of the Canola produced, which aligns itself well with the logic behind using ICE futures as Canada follows a similar trade flow.

In figure 1, the seasonality is shown for ICE futures (converted in A$/MT). In these seasonality charts, rather than use a min/max for the seasonality banding (green shaded area), we use a 70% range (or 1 standard deviation). The 70% banding is used to remove the extremes in the marketplace, which we believe gives a better indication of the seasonality, as opposed to a min/max which can be extremely volatile. In these charts, we also overlay the average for the timeframe and the recent seasons.

During mid-year of 2019 ICE canola futures traded at the bottom end of the range, however, they have drifted higher throughout the year albeit are only now trading at the average for the past decade. If we follow the seasonality, we tend to see the largest rises in the middle of the year. This corresponds with the northern hemisphere weather risk period, and a similar pattern is evident in wheat.

In figure 2, the basis between ICE and local canola prices is displayed. As we can see the local price has increased versus the rest of the world to record levels (Port Kembla). At present basis, levels are extremely strong. The strength in basis levels is due to scarcity of supply, and we shouldn’t expect to see these levels repeated in 2020/21 unless we see further supply shocks locally.

Remember to listen to the  Commodity Conversation podcast by Mecardo

What does it mean/next week?:

The Australian market is currently trading at very strong premiums to Canadian canola futures. It is highly probable that these basis levels will decline next harvest (if we have an average crop).

At present, I recommend using physical sales of canola, whilst the market remains strong.

A great start to your 2020 grain marketing

The price received in Australia is composed of futures & basis*. It is possible to lock in the futures component through using derivatives (swap/futures etc).

In figure 1 the forward curve is displayed in A$/mt. The forward curve shows the futures price for forward contract months.

The December 2020 contract which aligns with the Australian harvest is currently trading at A$316/mt. This is the highest level in five years, and provides a strong starting point for marketing grain.

As mentioned before the futures price is one component albeit one which makes up the majority of price (even in drought years – see here).

If using swaps/futures, the final price you receive will effectively be your futures price (A$316) plus basis at the point of physical sale.

In figure 2 the weekly average basis is displayed since 2010. As we can see the past year and a half is probably not a reliable indicator due to the drought led basis. However, the average across the country is:

  • Adelaide A$28
  • Geelong A$37
  • Kwinana A$49
  • Port Kembla A$51
  • Port Lincoln A$24

On the law of averages locking in futures and selling on average basis would return between A$340 & A$366. A price that is historically attractive.

*For the purpose of this analysis we are not including FX, and basing on a converted futures price.

Remember to listen to the  Commodity Conversation podcast by Mecardo

What does it mean/next week?:

The futures market is currently offering strong levels for December 2020. A large proportion of the rise in recent weeks has been due to geopolitical factors – which could lead to volatility.

At present these are high levels compared to the last five years. If you lock in a little at these levels, and it turns out to be the worst trade you do – it is still likely to be profitable.

Little and often wins the day.

We are removed from the rest of the world. Or are we?

In our analysis last Thursday, the three main components of pricing were briefly discussed. One of the important factors is the basis. In this analysis, I look at whether basis is the most important factor and whether we are disconnected from overseas markets.

The basis level is largely driven by domestic factors. When we have a large crop the basis level drops, conversely a small crop leads to higher basis levels. It is important to be monitoring basis levels as they provide an indicator of when it is best to sell.

During this drought, we have seen basis level rise to extraordinary levels, with the highest levels clearly being in the areas where the supply was diminished, and demand remained strong (figure 1). At points during the drought basis levels in Port Kembla achieved +A$215 over spot futures.

This has made many believe both producers and consumers that there is no need to consider the overseas price. This is not the case, in order to protect from adverse price risk, the futures market needs to continue to be considered.

In figure 2 basis is displayed as a percentage of the overall price. At the height of the drought pricing basis levels approached on average 40% on the east coast, however, they have since declined. In recent times, for instance, Geelong, Adelaide, and Kwinana have reverted close to their long term averages.

At present, the overwhelming majority of the price is comprised of the futures pricing component, which can be easily hedged on long horizons.

Remember to listen to the  Commodity Conversation podcast by Mecardo

What does it mean/next week?:

Basis is an important factor when pricing grain. As a producer, when the basis is high it is better to sell basis and maintain exposure to futures.

As a country that typically exports wheat, overseas futures are the biggest driver of prices in Australia. Although drought can cause large swings in pricing at a local level, it is important to still consider overseas futures in your marketing strategy.

Only one week in the doldrums for mutton

Before Christmas mutton prices took a dramatic downturn.  The talk was Chinese demand suddenly evaporating.  The New Year has seen mutton return to previous levels, while lamb has also found some strength.

Figure 1 shows the bounce in mutton prices, the National Mutton Indicator closed 2019 at 489¢, and closed yesterday at 561¢/kg cwt.  Holding sheep for the extra three or four weeks has definitely been worth it, with $15-20/head added to the price.

Lamb prices have also bounced off 8-month lows hit at the end of December.  Figure 2 shows the Eastern States Trade Lamb Indicator (ESTLI) has gained 40¢ to start the year, moving to a nine-week high of 738¢/kg cwt.

While lamb prices are still behind some of the forward contracts on offer in the late spring, we can see from figure 1 they are well ahead of this time last year.  It took until May in 2019 for the ESTLI to move above 740¢/kg cwt.

In WA lamb and mutton prices have opened lower in saleyards, both well behind the east coast.  The WA Trade Lamb Indicator opened at 614¢/kg cwt, while the Mutton Indicator is at just 387¢.  If the rain falling in NSW keeps coming WA mutton will have to rise, or sheep will start travelling east in droves.

Next Week

The fire may have seen a short term spike in sheep supply, as have the higher prices early in the year.  We expected sheep supply to tighten anyway, but the wet weather on the forecast should see things tighten significantly.  It will be interesting to see if prices do move higher, whether they will be able to draw out more sheep.

Lamb supplies are less predictable, but rain, and potential grass growth, can only see more lamb retained, and less destined for processors.

Have you (ever) seen the rain?

“Someone told me long ago. There’s a calm before the storm. I know it’s been comin’ for some time” and it arrived this week with some excellent rainfall to many areas in need. Combined with an improved three-month outlook from the Bureau of Meteorology (BOM) it helped give cattle markets a lift for the first trading week of 2020.

Social media abounded with images of water flowing across previously parched grounds and filling dams, not to mention aiding firefighters in fire-affected areas. Falls up to 50 mm were reported in places that hadn’t seen rain for a long time, particularly through northern NSW and Western Queensland.

The good news is that it isn’t over yet, as Figure 1 highlights, there is more in store for the coming week across the eastern seaboard. Cattle markets responded well to the news with modest gains of 5¢ to 45¢/kg lwt across most cattle types throughout the eastern states.

On the MLA reported national indicator cattle categories yearling steers purchased by restockers showed the strongest gains on the week, up 22.5¢ to 265.6¢/kg lwt. Medium cow also managed a strong showing with a 21.1¢ lift to finish at 205.3¢/kg lwt. The Eastern Young Cattle Indicator (EYCI) mirroring the broader market to see a 38¢ lift over the week, closing at 515.5¢/kg cwt – Figure 2.

As we pointed out in our analysis earlier this week the 90CL manufactured beef export price to the US has eased significantly from its 2019 peak, but thankfully the weather trumped the international beef market moves. Furthermore, there is still a huge gap for the EYCI to make up should climatic conditions remain favorable for an extended period and begin to encourage restockers back into the market in a serious manner.

Next week

The mid-month BOM rainfall forecast release shows there is some hope for the first quarter of 2020 with much of the country showing a 50/50 chance of a wetter or drier than average outcome – Figure 3. I know a 50/50 chance isn’t too much to get excited by just yet, but it is the most positive long-range forecast we have seen in some time.

The BOM suggests that the two key factors that had been keeping moisture away from the continent (a positive Indian Ocean Dipole and a negative Southern Annular mode) are now breaking down, allowing an improved chance of rainfall events occurring. Certainly, the week ahead is looking promising and this should give credence to a continued revival in cattle markets in the short term.

Wool delivers volatile opening

The strong finish to 2019 wool sales provided the platform for an impressive open to the 2020 selling season. The robust demand over the Christmas break on electronic offer boards provided the entrée to spirited activity on the auction floor when sales recommenced on Tuesday.

However, the fragility of the market was reinforced on the final two days of selling. By Thursday, with only Melbourne & Fremantle in action the market had given back much of the early week gains.

The Eastern Market Indicator (EMI) lifted 79 cents early on Tuesday before easing to close at 1,609 cents, in the end an improvement to the 2019 December close of 51 cents. The AU$ strengthened, up .06 cents to sit at US $0.69. In US terms, this moved the EMI up 45 cents to 1,111 cents.

The Western Market Indicator (WMI) also had a good week gaining 16 cents for the week to finish at 1,687 cents. Initially, W.A. played catch up to the opening prices of Sydney & Melbourne, however, it then reverted to the buyers’ more cautious approach evident in later sales.

The national offering of 52,261 bales came forward, a typical elevated January offering. The pass in rate increased slightly (heavily influenced by Wed & Thursday sales) to 10.5% nationally. This meant that 46,789 bales cleared to the trade. This was the largest clearance of bales since January 2019.

The dollar value for the week was $80.95 million, while the combined value so far this season is $1.139 billion.

The market is currently displaying a level of “nervousness”, caused by a combination of relatively high prices, tight supply (with the expectation of further dwindling supply later in the year), and growers’ propensity to happily pass-in wool. This is a welcome situation for sellers, but equally a more difficult market for buyers and processors to navigate.

The crossbred types ended the week largely unchanged, although the strong buyer activity early in the week pushed crossbred wool prices up by 10 – 20 cents before retracing. Cardings in all centres finished stronger, ending the week 40 – 50 cents to the better.

The week ahead

Despite the late week fluctuations, the market performed well under increased supply.

Next week is another substantial offering of 59,890 bales. There will be a close watch this week on the offer boards to try to glean an indication of market direction.