Tag: Commodity

Anti-dumping probe continues to leave uncertainty

Usually the market is relatively busy at the start of harvest, however, at the start of November things are going off with a whimper. In this update we talk about the lack of bids & volume on ASX.
The ASX wheat contract has been relatively inactive this week. The contract for Jan 2020 has been settling in a very narrow range of A$337-339/mt for the past nine days. The spread between bid and offer has remained wide during this time, and traded volume is low.

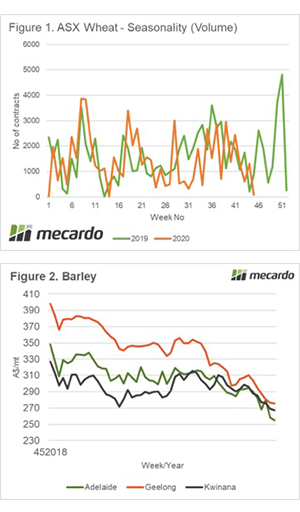
In figure 1, the seasonality of ASX volume is displayed. Throughout most of this year, volume has followed the 2019 contract. This week however, volume has dropped to 75 contracts (or 1500mt). This volume is likely to increase into December as positions are closed.

The big talking point with consumers and growers is barley pricing. This week prices have declined marginally, however, they have been on a downward plunge since seeding. Due to this discount to wheat, barley is now far more attractive to feed consumers. Bids from buyers have dried up with consumers buying hand to mouth.

The big question at present is the result of the anti-dumping investigation by China. As the investigation was instigated last November, the results should be published this month. The World Trade Organisation stipulates that anti-dumping investigations must be completed within a year, although there is the possibility of a six-month extension.

This uncertainty has meant that exporters are unwilling to take a ‘punt’ on the resolution, especially after many trading businesses made large losses during the past financial year. This has removed a large proportion of demand, with domestic being the only available avenue open.

What does it mean next week?

The uncertainty around the barley anti-dumping probe is impacting trades capacity to purchase large volumes of barley. In addition, there is a question mark in relation to Chinese feed demand due to the African Swine Fever outbreak.

The WASDE report will be released overnight. At this point of the year, the report should provide some stable numbers for this season. This will give some clarity on carryout.


No real reaction to rain forecast -yet

This time last week we were bemoaning the lack of rainfall on the forecast, and predicted more sideways action in markets. They say a week is a long time in football, well it seems to take forever when rain comes on the forecast and we wait for it to fall.

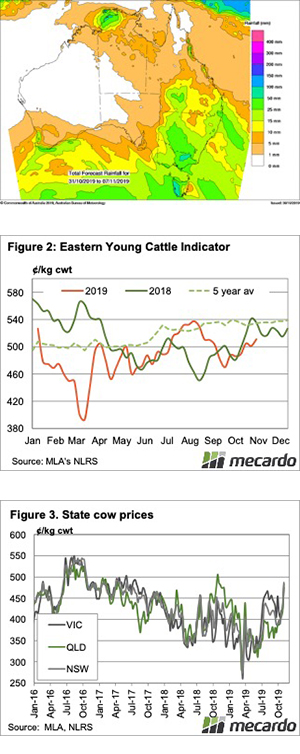
The rain that has fallen in Western Queensland, and is forecast to fall over the weekend (Figure 1) in New South Wales and Victoria hasn’t yet had much of an impact on markets. The Eastern Young Cattle Indicator (EYCI), the price most likely to get a boost from rain, did rally 10¢ this week though.  Yardings were up by over 5%, so perhaps demand did improve a little, to push the price to a six week high.

In Victoria, it seemed the flow of grassfed cattle to yards overwhelmed demand to an extent.  Domestic feeder steers held their ground, but heavy steers were 12¢ lower at 566¢/kg cwt.

There was a lot of action in over the hooks markets in Queensland last week. Trade and heavy steers lifted 20¢ to 580 and 590¢/kg cwt respectively. Finished cattle supply in the north must be waning, with Queensland now at a premium to WA.

Cows in Queensland were very strong this week. A 16¢ rally took Queensland cows to 483¢/kg cwt, a 12 month high. Figure 3 shows cows have gotten expensive all across the east coast, with export prices driving competition.

Next week:

What happens next week really depends on how much of the forecast rain actually falls. Some key cattle areas are going to miss out, but those which have had a good year to date will have spring extended.

Prices aren’t likely to go down in the current environment, but the upside is also limited until there is some follow-up rain.

Pressure on markets but support should be found

Sheep and lamb markets continued to slide this week, with supply ramping up. We don’t know what happened with yardings and slaughter this week yet, but last week sheep slaughter was heading higher.

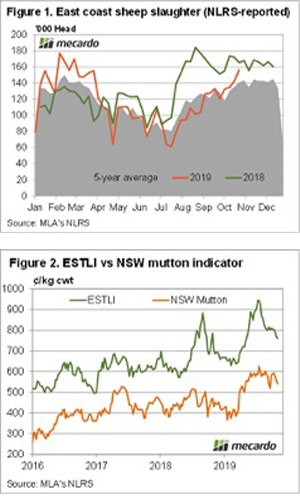
Figure 1 shows sheep slaughter on the rise, well above average levels and heading towards last year’s extraordinarily strong

rates. Improving supply of sheep, and to a lesser extent lamb, has put a dampener on prices.

The Eastern States Trade Lamb Indicator (ESTLI) fell 12¢ to 760¢/kg cwt (Figure 2), a six month low.    Figure 2 shows NSW Mutton prices fell more heavily, losing 34¢ to 550¢/kg cwt, but they are doing a bit of a yo-yo at the moment, having gained a similar amount a fortnight ago.

In Victoria, Mutton prices held around 600¢, as while supply is increasing, demand for mutton is supporting prices.

Store sheep markets are running hot. With young ewes making well over $200 per head and ewes with lambs reportedly making over $400, it appears restockers are getting in before the anticipated price rise.

The price rise could come sooner rather than later.  At least markets should steady with the rain on the forecast over the coming week. There might not be many sheep left in NSW, but the rain will see any that might have been sold being held. It will be hard for sheep slaughter to keep rising.

WA sheep and lamb markets continue to lag well behind the east coast. This isn’t unusual for this time of year, with the season finishing. Demand from across the Nullabor might add some support if the rain keeps coming.

Next Week:

There were some strong forward contracts released for Northern NSW yesterday, with lamb at 820¢ and mutton over 600¢ in January. These prices are ahead of current rates, but if the forecast rain falls, and is followed up, we could get there a lot quicker.

Sellers line up

It is an unusual situation in commodity markets where the seller can move the market price, but a glance at the wool market over the last few months shows growers either selling aggressively on market rallies, or holding back on soft markets.

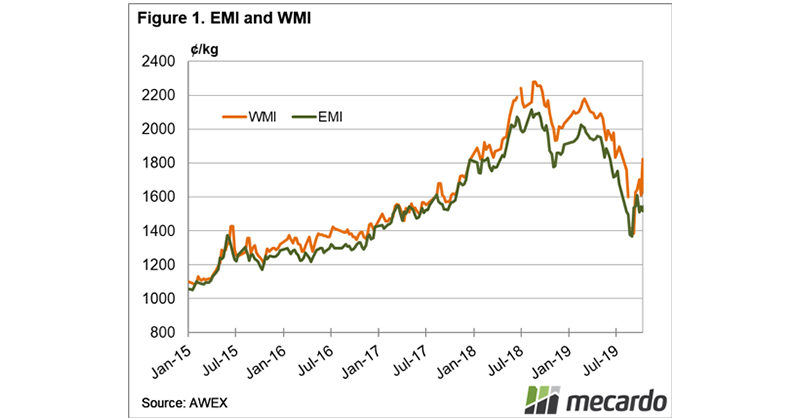
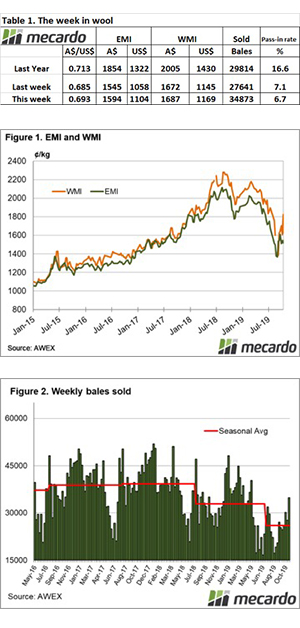
The pass-in rate has been in direct contrast to market moves, a falling market met with high pass-in rates and vice versa. This strategy has certainly supported the wool market with sellers reducing supply in the weeks where buyers have had little interest.

This week the Eastern Market Indicator (EMI) gained 49 cents (after rising 28 cents last week), to close at 1594 cents. The Au$ also rose to US $0.693, causing the EMI in US$ to also lift by 46 cents to 1,104 cents. The WMI also rose, however, a softer market in Fremantle on Thursday resulted in a gain of just 15 cents to 1687.

This market rise resulted in another week of single digit pass-in rates – sellers taking the opportunity to clear wool on a rising market. This week the PI rate was 6.4% nationally.

There was a bigger offering of 37,381 bales, almost 8,000 bales more compared to last week’s volumes. This resulted in a big lift in the number of bales sold, up 7,200 on last week to 34,870. This is the largest clearance to the trade since May. The supply shortfall continues though, compared to the same period last year 108,541 fewer bales have been sold. This equates to an average weekly gap of 7,200 bales since July.

The dollar value for the week was $63.65 million, with a bale average value of $1,825, up $55 per bale on last week. The combined value so far this season is $678.15 million.

AWEX reported that the Crossbred section was the strongest on the week, with prices lifting 35 – 70 cents. Cardings again were quoted dearer with locks, stains and crutching posting 50 to100 cent increase, to average a 65 cent lift.

The week ahead

Next week another solid offering is listed, with 36,400 bales across the three centres. This size roster is forecast for the next three weeks.

Despite the increased offering the market this week was strong, there was however a cautionary note with Fremantle on the last day tending weaker.

Ever tightening cattle supply projections

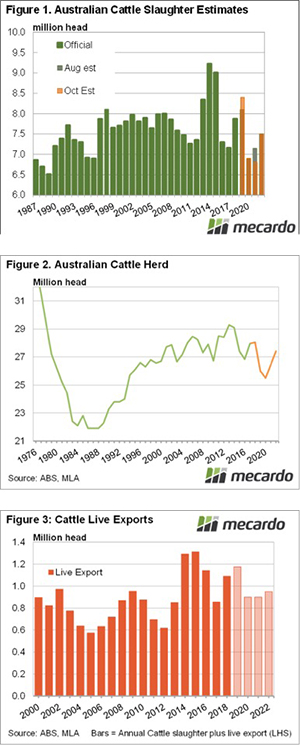
We can’t keep slaughtering female cattle at such a rapid rate without having an impact on the future herd and cattle supply. Meat & Livestock Australia’s (MLA) October update to its Cattle Industry Projections has taken recent slaughter into account and forecast the lowest slaughter in thirty years, for two years in a row.

Continued strong cattle slaughter in general, and female slaughter in particular, has seen MLA revise 2019 total slaughter higher again. This time MLA have lifted 2019 cattle slaughter to 8.1 million head, 3.7% higher than the August estimate (figure 1). Since the first projections of the year, MLA has added 800,000 head, or 10.5% to 2019 slaughter.

The dry weather and continued herd liquidation have driven the rise in this year’s slaughter and taken cattle away from the future. MLA made minor changes to herd estimates. Figure 2 shows the herd is expected to decline by 2 million head when we see the June 30, 2019 herd figures. Continued strong slaughter in the second half of 2019 will see a new low, but only a slightly lower herd in June 2020.

With most of the herd decline expected to be behind us, plenty of cattle needed to be stripped from future slaughter to see herd growth. Figure 1 shows that MLA has kept the slaughter forecast for 2020 at 6.9 million head, but decreased the 2021 slaughter forecast to a new 30 year low of 6.8 million head.

The 2021 slaughter forecast is to be 5% lower than the previous forecast and a massive 19% decline in 2019. The last time slaughter was below 6.85 million head was in 1989, thirty years ago. The increase in 2019 slaughter has effectively been taken off 2021. In 2022, cattle slaughter is expected to get back to 7.5 million head, which could be a struggle with the herd still growing.

Live exports are also expected to decline in the coming years. Figure 3 shows that after an 8% rise in 2019, MLA expects a 23% fall in 2020. Strong live export demand is expected to keep numbers at levels well above historical lows, despite what is expected to be very strong slaughter pricing.

What does it mean?

We have been talking for some time about strengthening export beef demand and if we get something near a normal season, we are going to see a collision on tight supply and strong demand.  We saw something similar back in 2016 and 2017, but this time supply will be tighter, and demand is currently stronger.

It is safe to expect strong rises and record prices for all cattle categories, but store cattle are going to see the largest upside.

This is a landmark harvest, but we will get clarity soon.

It’s six days after Halloween. A night of monsters and scares. However, for farmers the scariest matter this year has been the downward progression of crop yields. This has been a landmark harvest where production has been massively down, but prices have declined, however, the headers will give the industry its much needed clarity.

The crop forecasters are now suggesting a <16mmt wheat crop. Which is substantially lower than the ABARES estimate in September of 19.1mmt, and down on last years 17.3mmt. We have spoken at length about the difference in the two years as production shifts back to the east coast.

The market has lost steam in recent weeks as consumers have confidence in being able to accumulate their volumes.  As harvest advances, we will get some clarity on the accuracy of forecasts.

One of the few places in Australia hanging on has been Victoria. In recent weeks the Grain Industry Association of Victoria has performed a crop tour. The forecast wheat yield is 2.31mt/ha (wheat) and 3.32mt/ha (barley). Abandonment has also declined year on year, with 8% being cut for hay versus approx. 30% last year.

When we remove this abandonment from the ABARES September forecast, it is now forecast that Victoria will produce 3.4mmt of wheat and 2.6mmt of barley.

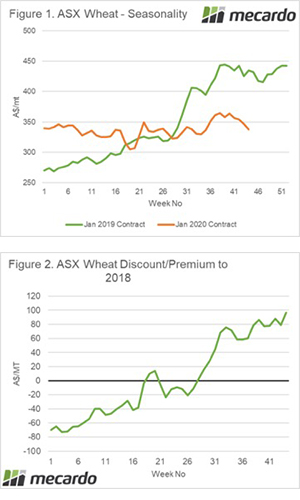
How are the markets reacting to the lower crop? Well there is a continued fall in prices in Australia. The ASX contract has fallen 3% week on week, or A$9 (figure 1). The gap between this year and last year has widened dramatically. At present the ASX contract is A$97/mt lower than this point in time last year.

This year due to the uncertainty most growers have sold less than normal ahead of harvest. This makes perfect sense as a strategy whilst crops have deteriorated. This however especially in Victoria could lead to a large volume of grain hitting the market all at the same time.

What does it mean / next week?:

Consumers are now examining their ability to increase their use of barley. Due to the wide spread to wheat, it is more attractive to feed. This will likely add some pressure to wheat prices, as demand technically drops by the maximum volume allowable as barley in a ration. However this may be short-lived.

The drive to harvest pulls down wheat pricing.

This season is all about local elements. The overseas market can be forgotten for now. In this update we take a look at the factors holding prices down and why it’s worth keeping an eye on overseas futures for next year’s harvest.

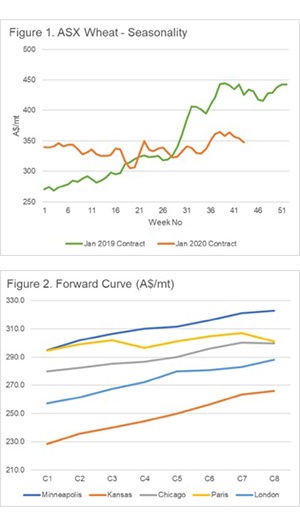
It’s been a disappointing week for producers when it comes to pricing. As harvest starts to progress, the ASX wheat contract has experienced its third week of downward pricing. The ASX wheat contract has followed a very similar pattern to last year since the crop worsened albeit with a large discount year on year (Figure 1).

Last year the ASX continued to decline until the end of November, before rising towards the end of the year. So why is the grain price falling rather than rising?

  • Growers are largely unsold coming into harvest. There is an increase in the number of offers from producers. The extra supply is in part pushing down pricing.
  • The Australian crop may well be below 16mmt this season. However, the balance between supply and demand is pointing towards domestic demand either being met or limited transshipments being required.
  • Overall demand in Australia is down year on year due to reduced feed demand after destocking. There is also the potential for imports into NSW to meet specific quality requirements, this may reduce a large proportion of domestic demand (approx. 500kmt.)

At Mecardo we think it is always important to look forward when marketing your grain. There are opportunities to be realized by having a forward-looking strategy. In Figure 2, the forward curve for the major grain bourses is displayed.

The market remains in contango. This is where the forward contract months are at a premium to the spot. This is a common occurrence in wheat and provides an opportunity to lock in high prices for future years.

Remember to listen to the  Commodity Conversation podcast by Mecardo

Next week:

It will be interesting to see whether this lower pricing point for ASX wheat brings consumers out of the woodwork.

There has been a hot blast drive through Victoria in the past three days. This could have hampered some crop development in the Wimmera and Mallee.

Uncharacteristic lift in NSW throughput weighs on price

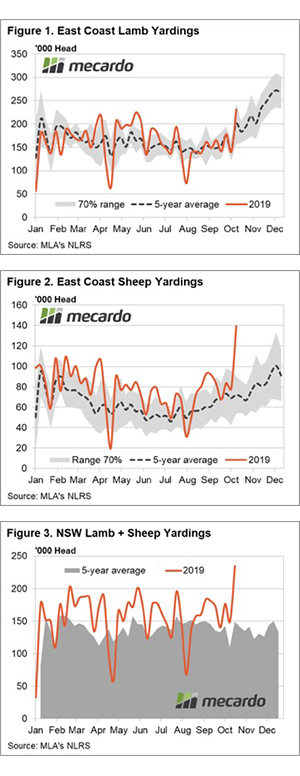
Significant increases to yarding levels for both lamb and sheep across the eastern states in recent weeks has started to weigh on prices. Higher than average lamb yarding was noted in Victoria but the big lift in lamb throughput was reserved for NSW. Mutton yarding levels were elevated in all east coast states.

Weekly east coast lamb yardings levels hit a seasonal high last week at 231,591 head representing a 64% jump on the week prior. This places lamb yarding levels 16% above the five-year seasonal trend for this time in the year (Figure 1).

Lamb throughput in Victoria is trekking 9% ahead of the seasonal average but underpinning the jump in east coast lamb volumes at the saleyard has been NSW flows. Lamb yarding for NSW last week was up 48% on the week prior and is sitting 31% higher than the five-year average trend at 142,305 head.

Increased throughput wasn’t reserved for lambs alone with mutton numbers swelling too. Weekly east coast sheep volumes at the saleyard up 79% on the previous week to hit a seasonal high at 139,169 head. At this level east coast sheep yardings are sitting at massive 94% above the five-year seasonal average and you would have to go back to 2006 to find a higher weekly east coast sheep throughput level (Figure 2).

Higher than average sheep yardings were noted across all east coast mainland states with SA 42% above the five-year level, Victoria 51% higher and NSW, again underpinning the broader east coast figures, with sheep yarding levels 135% higher than the seasonal trend for this time in the year. Figure 3 shows the combined lamb and sheep throughput for NSW and it demonstrates how unusual this increase in saleyard volume is.

The National Trade Lamb Indicator (NTLI) feeling the brunt of the increased supply easing 4.2% this week to close at 770¢/kg cwt yesterday. Unsurprisingly, NSW Trade Lambs were lower too, slumping 4.8% to finish at 783¢/kg cwt. The National Mutton Indicator (NMI) eased 2.1% this week to 555¢/kg cwt. NSW mutton prices holding up well considering the elevated supply in recent times, dipping just 2.2% to close at 577¢/kg cwt.

Next week

The Victorian spring flush is underway but the significant numbers we see into November are yet to come. There is some rain forecast for Victoria this week which will allow producers to hold lambs for a bit longer if they are keen. Prices favour a downside bias until some of the Victorian supply is able to be accounted for.

Another week, another rise in export prices

The Aussie dollar was higher thanks to improving prospects for China/US trade, and declining chances of an interest rate cut next week. This had little impact on export prices however, with higher US value-driving export prices higher.

The story is the same, Chinese demand is diverting product away from the US and importers are scrambling for available lean manufacturing beef. Our slaughter rates remain relatively high, but the Chinese seemingly have more money than the US at the moment.

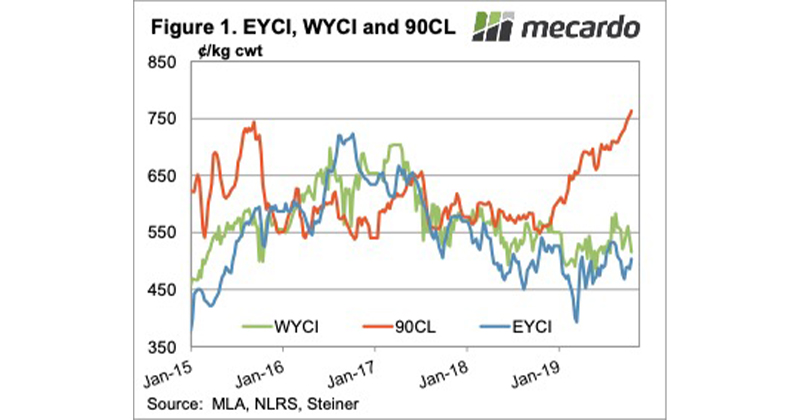
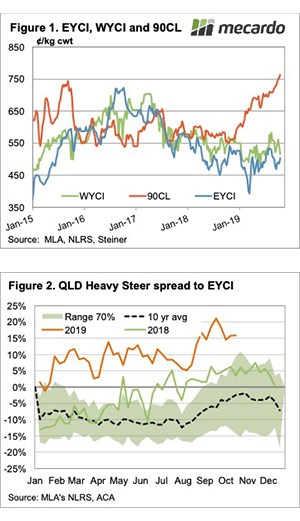
Figure 1 shows that the 90CL Frozen Cow indicator has rallied with only a couple of hiccups for the last 11 months. Needless to say, current prices are at record levels. Figure 1 also shows how far behind the Eastern and Western Young Cattle Indicators are.

This time last year local young cattle prices were at a small discount to the 90CL, now export prices are the only thing holding young cattle prices at reasonable levels.

Cattle price moves were rather benign this week. Slaughter cattle remain very well priced. The most expensive indicators in the country were the Queensland and Victorian Heavy Steer, at 568¢/kg cwt.

The Queensland Heavy Steer premium to the EYCI has fallen from 20% to 15% (Figure 2), and it’s well above the same time last year. With export beef in demand and young cattle not so much, this isn’t a surprise.

Next week

With no real rainfall on the forecast, we can expect more of the same for the coming week. For markets to go lower, either export markets need to fall, or cattle supply increase. At this stage it’s hard to see either of these things happening, so we continue to wait for rain for the upside.

How volatile are wool prices?

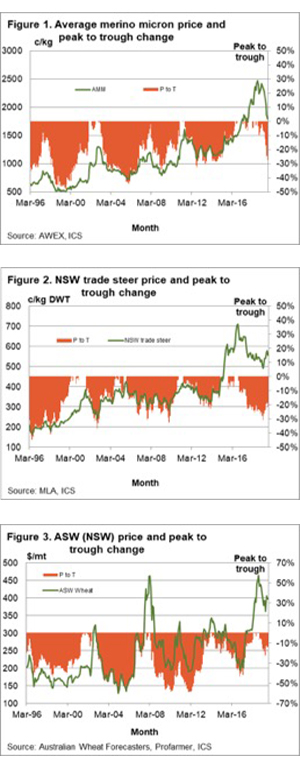
As humans, we outweigh the reaction to losses more than the benefit of gains. So, it pays to look at longer-term data to test this emotional reaction, seeing whether it is grounded in reality or simply an emotional response. This article takes a look at the size of cyclical downturns in Merino wool, beef and wheat during the past two decades to put the recent fall in wool prices in a less emotional context.

The average Merino micron price is down AUD700 cents on mid-2018 levels. Peter Small, writing in Sheep Central recently, described a young wool grower asking about price stabilisation as an answer to recent falls in the wool price (view here). The question implied that the fall in wool prices during the past year has been unusual, but is it?

Figure 1 shows the monthly average for the average Merino micron price from 1996 to last month. It nearly touched 2500 cents in mid-2018, and is now around 1800 cents. It has certainly been a big fall in price, from a high level. Also shown in Figure 1 is the change in price from the highest price level of the previous five years. The idea is to look at the depth of the down cycles in terms of the proportion that prices fall from the peak to the trough (P to T). In the late 1990s, when many apparel fibre prices were depressed, the Merino price fell from 1997 peak levels by around 45%. It fell a similar proportion in 2005, down from the 2002-2003 peak. In 2009, the price only fell by 30-35%. In 2012 through 2015 the price fell from the 2011 peak by a more modest (again) 30%.

Currently, the market is 27% below 2018 peak levels, roughly on par with the 2012 downturn. The current downturn is therefore (so far) moderate and similar to the previous down cycle. The down cycles have become less severe in the past two decades, which makes sense as the level of stocks and production have fallen.

How does wool compare to beef? Figure 2 repeats the exercise for a NSW saleyard trade steer price. Since the 1990s down cycles have resulted in a fall of 25-30% from prior peak levels. The 2014 down cycle was appreciably smaller at around 20%.

Figure 3 treats a NSW wheat price series (Newcastle zone) in the same manner. Wheat shows up as more volatile, with some hefty down cycles where prices fell by 50%. There have been a couple of down cycles in the order of 30%, as well.

The take-home message from this very brief look at price volatility is that the average Merino wool price has comparable price volatility to beef and wheat. Down cycles do vary, but it is hard to make a case for the Merino price being in a league of its own in terms of price volatility.

What does this mean?

The average Merino price has fallen by around 700 cents since mid-2018. For those of us anchored in the 1990s that is a frightening number as it was once a (successfully) hedgeable price in its own right for 21 micron. In proportional terms though, the current downturn in wool prices looks to be playing out to it standard of the past decade. In comparison to trade steer and wheat, the wool market is not overly volatile – just a commodity price which goes through patches of strength and weakness.