Month: August 2019

Dry spells profit for processors

The updated Mecardo processor margin model shows that meatworks profitability has continued to soften in recent months for beef processing, reducing by 48% from the peaks achieved in May 2019. However, despite the narrowing, margin processor’s bottom line remains in good shape with the annual average margin sitting over five times higher than last season.

This processor margin model is designed to reflect the general trend in meatworks profitability and should be viewed as a reflection of an average industry participant. Due to the diversity in the scale of operations, internal processes, and supply chain differences across the red meat processing industry, individual meat works profitability will vary from the results demonstrated in this article. Furthermore, input data used in the model can be revised post reporting each month as updated data becomes available.

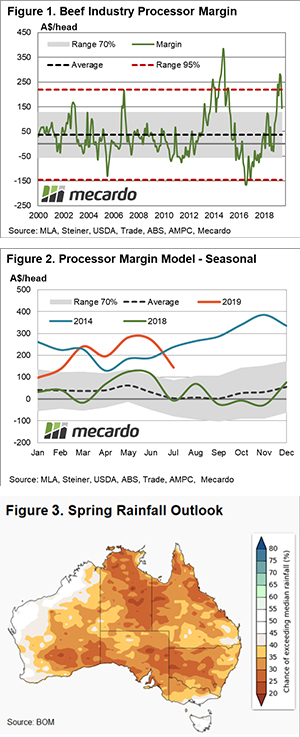
Figure 1 demonstrates the trend in the processor margin on a monthly basis since 2000. Earlier in the season, we saw margins extend outside the upper boundary of the extreme range beyond $220 per head of cattle processed. Ongoing dry conditions across NSW and southern Queensland have kept the cost of cattle entering meatworks relatively subdued while improving offshore beef prices have helped margins expand.

In the last few months, the processor margin has eased toward the top of the 70% range. Based on the historical monthly margin data, this range demonstrates where the margin has fluctuated for 70% of the time since 2000 and gives an indication of the “normal range” that could be expected to be earned by a processor per animal, which is between a $55 loss to a $130 profit.

A look at the seasonal trend in the processor margin shows that average monthly profit levels have eased toward $145 per beast processed in July after peaking at over $280 during May 2019. The annual average margin for 2019 sits at $195 profit, compared to just $36 per head for the 2018 season – Figure 2.

What does this mean?

A comparison to the 2014 season shows the impact a drier than normal spring and summer can have on processor margins as the annual average margin for the year reached $255.

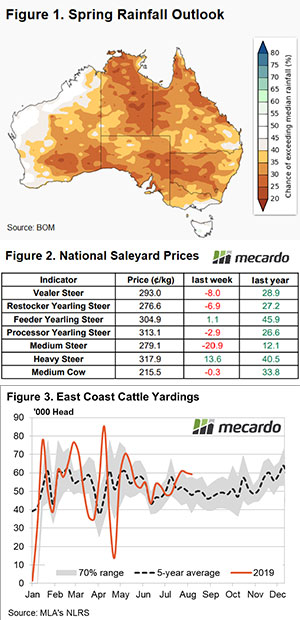
During 2014 the processor margin continued to improve throughout the latter half of the season peaking at over $385 profit per head in November. The drier than average forecast leading into spring issued by the Bureau of Meteorology last week (Figure 3) should continue to support firm processor margins into the second half of this year.

Key points

  • Processor margins have continued to ease in recent months, falling from the May peak over $280 profit per head toward $145 in July.
  • For the 2019 season the annual average margin sits at $195, compared to a $36 profit earned during 2018.
  • During the last significant drought event in 2014 processor margins reached an annual average profit of $255 per animal processed.

Wool market hits the breaks

The severe price dive of last weeks market thankfully eased this week. While Merino categories still experienced declines, producers can take some relief knowing that the “emergency” status seems to have been called off for now.

The Eastern Market Indicator fell 16 cents for the week to 1,497 cents. The Au$ saw nearly no change on the week, sitting at US $0.678 at the weeks close. The EMI in US$ terms fell 11 cents to 1,015 cents (Table 1).

AWEX report that better style wools with good additional measurements attracted strong competition and held their ground. However, lack of demand for lesser style wools dragged the market down. The Crossbred sector provided the only positives, gaining 25 to 40 cents.

26,492 bales were offered at Sydney and Melbourne, with no sales occurring in Fremantle. With the shock factor over, sellers were more accepting of this week’s prices and 16.1% of the offering was passed in. This saw 22,216 bales cleared to the trade. For the season to date we’ve seen 46,628 fewer bales sold than the same period in 2018-19.

The dollar value for the week was $36.99 million, for a combined value so far this season of $241 million.

The week ahead

The mix of market sentiment from brokers hopeful for a bounce to exporters thinking the market can weaken further provides little indication of what we can expect in the coming weeks. Although to look at the market from a technical perspective, prices appear to be at their support levels in foreign buyer terms.

33,046 bales are rostered for sale next week, with sales resuming in Fremantle and a designated superfine sale in Sydney. In the weeks following, 36,025 and 33,766 bales are expected to come to sale.

Tanking time for lambs not for mutton

It is tanking time for lambs, but not so much for sheep. Supply has been improving for both lamb and sheep, but it’s only lamb prices which have been on the wane. WA is a different story, with lamb and sheep values both falling heavily.

The Eastern States Trade Lamb Indicator (ESTLI) fell again this week, but the rate slowed a little. The ESTLI was back at 806¢/kg cwt on Thursday, which while being down 120¢ for the month, and 27¢ year on year, is still a very good price. Figure 1 shows it was only for a short period the ESTLI was higher last year and before that 800¢ seemed fanciful.

Interestingly, restocker lambs are priced 130¢ higher than this time last year, at 830¢ it’s not that much stronger than the ESTLI.

Mutton prices rallied marginally this week (Figure 1), with sheep supply remaining tight and export demand very good. There might just be money in mutton for processors at 600¢, and hence competition remains strong.

Combined sheep and lamb slaughter has been rising with processors coming back online after seasonal maintenance. Figure 2 shows combined sheep and lamb slaughter hasn’t been this low at this time of year since 2011. There is room for another 170,000 head of sheep and lambs to be slaughtered per week. This shows that supply remains very tight.

In WA, lamb and mutton prices continued to ease (Figure 3).  Mutton in the west is now close to 200¢ below the east. On a 20kg cwt sheep this is $40, which is more than enough for WA sheep to start to work their way east.  Further WA mutton price fall should be limited.

Next week?:

The forecast shows more rain for the south of both the east and west, but none for the drought-stricken zones. Demand for store stock is unlikely to improve, but it isn’t likely to impact on finished stock too much.

Lamb prices are looking for a base and 800¢ might be it. If it falls through 800, it is headed for 750¢.  Still a good price for sucker lambs, but starting to fall well below the forward contracts which have recently been on offer.

The market didn’t like the forecast either

Last week we looked at the Bureau of Meteorology (BOM) spring rainfall forecast and it would seem the market looked at it as well.  Young cattle prices took a dive this week, but finished cattle prices maintained their strength.

Figure 1 shows the Eastern Young Cattle Indicator (EYCI) losing 20¢ this week to hit a seven week low of 508.25¢/kg cwt. EYCI yardings were lower, but the tighter supply didn’t seem to matter, with buyers pulling back. A 52¢ fall in prices at the Roma store sale and a 36¢ decline at Wagga were the main contributors to the fall.

No doubt the forecast for a drier than normal spring across almost all of the east coast, has pulled demand back. It’s not quite as weak as this time last year, but it is heading that way.

Finished cattle price, especially Heavy Steers are holding their strength.  Figure 2 shows both Victorian and Queensland Heavy Steer Indicators are close to three year highs.  Beef export values are very strong, and no doubt seeing strong demand for cattle which are ready for slaughter.

Cow prices are not faring so well, as is often the case in dry times. In Victoria, where there has been some rain, Cows are near two year highs.  In Queensland the Cow Indicator is showing the impacts of the dry, although they defied the trend this week, rising to 416¢/kg cwt.

In the West, cattle prices eased, but remain at a premium to their east coast counterparts.  The WYCI fell 24¢ to 559¢/kg cwt, and is obviously being helped along by continued very strong export prices (Figure 3).

Next week?:

Dry weather in August and September is never good for young cattle prices. With hot weather approaching, a lack of rain saps demand and increases supply.  The question is how far finished cattle prices can get ahead of young cattle.  Victorian Heavy Steers were at more than a 100¢ premium to the EYCI this week.  It is hard to see grass finished supplies improving any time soon.

Knife-edge market

The midyear fall that has been a striking pattern in recent years has reoccurred during 2019. The middle of the year is always full of little surprises which can drive the market strongly but quite often the bearish fundamentals come back to bite.

The Chicago wheat futures market has fallen rapidly from recent highs in early June. The current December contract is now only 20¢ off the contract lows. This is concerning for farmers, however, the rise did provide growers with good opportunities to hedge at healthy levels.

There is a strong correlation between wheat and corn futures (see here), which means that when corn falls – wheat will follow. The market rallied due to excess water concerns and the reduced ability to plant the US corn crop.

The USDA, however, has released report after report showing that planting and yields were strong. A sentiment which surprised many industry participants. Crop tours of the major corn belt regions have shown results which are variable but better than expected overall. This, in connection with benign weather which will help crop development, has led to a further bearish undertone.

Locally, the ASX contract has seen falls, with the harvest contract declining to A$327. The contract has stayed stubbornly strong despite falls in overseas levels, which has meant that basis has risen strongly. The east coast Australian crop is still on a very, very sharp knife-edge. The forthcoming critical growing period needs to provide rain for the regions that still have potential.

The trading range for ASX over the past six months has been extremely wide, with a low of A$296 to a high of A$359.50. These are levels which have provided attractive opportunities for both producers and consumers.

Remember to listen to our podcast

Next week?:
The trade participants will be digesting the insights from the US crop tours. If the weather across the corn belt continues to be conducive to the growth of the corn crop, I wouldn’t be surprised to see pricing fall to May-contract lows.

Locally in Australia, it is a very tense time where all eyes continue to be on rain radars!

Weekly Wool Forwards for week ending 23rd August 2019

It seems no coincidence that when the auction market began freefalling, no forwards were traded. This week, interest in forwards has begun to pique again, albeit centralized around the most popular MPGs.

In 19 Micron wool, four trades were deal this week. For September, one trade agreed at 1,680¢. For October, one trade agreed at 1,665¢ while for November one trade agreed at 1,680¢. One trade was dealt for February of next year and agreed at 1,750¢.

In 20 Micron wool, one trade was dealt and agreed at 1,645¢ for October.

In 21 Micron wool, five trades were dealt, four of these in September agreeing between 1,660¢ and 1,680¢. One trade was dealt for November and agreed at 1,650¢.

As with the auction market, sentiment seems mixed, but there does seem to be some confidence in slightly lower prices in the short term, with some hope for a rally heading into 2020.

Maybe now it can only go up?

Dive, crash and plunge are the headlines strapped to this weeks wool market which saw the largest correction in percentage terms in the last eight years. In absolute price terms, it was the largest in the last 16 years. That being said, with the Eastern Market Indicator currently at 1,513 cents, prices are still higher than the previous two peaks.

The EMI lost 112 cents on the opening day and a further 52 cents on Thursday, for a total 163 cent drop. The Western Market Indicator (WMI) didn’t escape the deluge, giving up 162 cents across the two days of selling to close at 1,598 cents. The AUD actually lifted which sheltered some of the loss in US terms to put the EMI at 1,026 US cents.

All microns and categories felt the fall. 19.5 to 21 micron lost around 200 to 210 cents on the week in all selling centres. Merino cardings were the least scathed of all categories, dropping between 10 and 50 cents.

Since the market started to turn from its peak last year, the EMI has dropped 26%. Although the speed of this fall has been significant, we have seen larger corrections before. In 2011 the market fell 33% in just over a year, and before that, the largest correction was from 2003 to the end of 2005 where it fell 47%, but in absolute prices that was just 569 cents.

When looking at the 19.5 and 21 micron in USD terms, this downward cycle has been very similar to the fall in 2011-2012. During that period the market found a base in the second half of August after strong sell-offs.

37,379 bales were offered at Sydney, Melbourne & Fremantle. As could be expected growers weren’t happy with the falling market and passed in a huge 35.8% of the offering. According to AWEX, this was the highest pass in rate since 2003. This meant that just 23,993 bales were cleared to the trade, 5,648 fewer than last week.

The dollar value for the week was just $39.63 million, for a combined value so far this season of $203.85 billion.

No forwards contracts traded this week.

The week ahead

The uncertainty in global trade has well and truly filtered through to uncertainty in the wool game. Market dynamics become less predictable, with normal supply and price behaviour often lost in the process.

However, the speed and scale of this correction have moved the market towards levels that would be considered good value in foreign terms. This should see some support return to the market.

Next week 33,969 bales are rostered for sale in just Sydney and Melbourne. 34,705 and 37,465 bales are currently forecast for the subsequent weeks.

Data brings certainty or uncertainty?

The USDA report surprised most stakeholders within the industry this week. It wasn’t a welcome surprise with prices declining across the board. In this update we take a look at the impact on pricing, and how Australian pricing is remaining strong.

This time last week there was a lot of anticipation by market participants of the forthcoming USDA reports. After false start 19/20 reports in July, the August reports were going to provide some much-needed clarity on the corn crop. It would give some certainty to how many corn acres had been abandoned. The reality was that the report had acreage and yield higher than most analyst expectations.

The result of such a bearish report on corn was as could be expected, falls in prices across the board. In A$ terms December futures retreated 5% or A$13.5/mt. This is a substantial fall and places December wheat futures back at the same level as mid may removing all the value of the June rally.

At a local level the ASX contract fell from A$342 last week to A$326, but has since rebounded to A$331 (figure 1). The basis between ASX and CBOT increased dramatically during July as CBOT declined and ASX remained stubbornly in a narrow trading range. This basis is since although conditions are reasonable (touch wood) in Vic/SA both NSW/QLD are in dire straits.

In figure 2, the basis levels between CBOT & new crop pricing around the country are displayed. As we can see all areas have increased. The biggest increase is in the Port Kembla zone which is a region unlikely to provide much to the Australian wheat balance sheet this season. This season will see continued movements from the south to the north to meet demand, this flow will likely to continue unless there is a strong sorghum crop.

Remember to listen to our podcast

What does it mean/next week?:

The 8 day forecast shows good falls for much of the southern cropping regions. As has been the case throughout this season (and the last two) the north is missing out.

If the USDA data is correct and is maintained through future updates, it is likely that globally we will maintain a low pricing environment. In Australia however basis will remain strong on the east coast whilst local demand remains strong and supply is short.

Brown is my least favourite colour

The first sneak peek at the spring rainfall outlook issued by the Bureau of Meteorology (BOM) yesterday paints a grim picture for cattle producers and you could say it’s a crappy forecast on account of all the brown patches spread across the country.

An elevated chance of a drier than average September through to November is slated for much of the country except for the western WA and Tasmania – Figure 1. Although this is the Bureau’s first glance at the spring outlook, with a more detailed picture to follow at the end of August, it is unlikely to change substantially as their accuracy for spring forecasts is usually moderate to high.

National cattle sale yard indicators responded accordingly this week to the gloomy rainfall forecast with most NLRS reported categories of cattle easing – Figure 2. Heavy steers the only group to buck the trend significantly with the national indicator climbing 4.5% to close at 318¢/kg lwt.

The national heavy steer indicator given a solid boost by NSW heavy steer which managed a 9% lift on the week to finish at 325¢/kg. Although NSW heavy steers aren’t the dearest in the country with the winter rain across much of Victoria helping support heavy steer prices there to see them top the table at 337¢/kg lwt, despite only gaining 1% on the week.

Dry conditions in the northern regions across the east coast continue to have weekly cattle yarding numbers running at elevated levels, above average and outside the upper boundary of the “normal range” for this time in the season – Figure 3.

Higher than average Queensland and NSW cattle yardings are the main drivers of the elevated east coast throughput. Over the last month Queensland sale yards have seen throughput running 34% higher than the five-year trend and NSW are 19% higher.  In contrast, Victorian cattle throughput numbers are sitting 8% below the five-year trend.

Next week

Despite the brown rainfall forecast for the three-month outlook there is some rain scheduled in the coming week for Victoria, Tasmania and the south west coastal tip of WA. Unfortunately, the rain subsides as you cross the Murray, so it won’t really be enough to get the cattle market too inspired. Expect further sideways price movements in the short term

It’s not as bad as wool

The lamb market continued to decline this week, and mutton managed to maintain its strength.  Wool producers can take some solace from this, in a week when wool prices have been tanking, at least their stock are still worth very good money. 

This time last year lamb producers were cock-a-hoop, with lamb prices busting through 800¢ and heading for new highs.  With prices this week at the same level, there is much less excitement.  This is especially the case for those with Merino’s.

The fall in prices slowed this week, with the Eastern States Trade Lamb Indicator (ESTLI) losing 22¢ to hit a three month low of 834¢/kg cwt.  Figure 1 shows the ESTLI is at almost exactly the same level as last year, although the price trend is in the opposite direction.

Lamb slaughter did lift last week (figure 2), but remains close to last year’s lows.  It will be interesting to see if lambs can keep coming, the historical trend is for rising slaughter from here, but anecdotal evidence suggests it should stay around current levels.

Mutton prices eased marginally this week, they remain over 100¢ above last year’s levels on the east coast. Sheep supply is tight, although falling wool prices might see a few more come to market in the spring.  It’s still worth shearing them, with skin values not matching the wool value.

In the west lamb and mutton markets did mimic wool, falling heavily.  The WA Trade Lamb Indicator (WATLI) lost 15% and mutton lost 16% (figure 3) with improving supply seeing prices fall back to first quarter levels.

What does it mean/next week?:

We might have seen the end of lamb slaughter lower than last year, as the difference has been large since May.  From here things might track at similar levels, although the dearth of sheep should support both mutton and lamb markets.

The Bureau of Meteorology released their three month outlook yesterday, and the depressing picture remains (figure 4).  There is little promise of drought breaking rainfall in NSW, with way too much brown on the map.  The question is whether there are enough sheep out there for another supply flush to push prices lower.