Month: December 2019

Fuel for the fodder

Key Points

  • Hay prices have fallen from the highs of last harvest.
  • Wheat holds a premium over hay in Victoria (+30%).
  • Hay holds a premium over wheat on the Darling Downs (-10%).
  • DD hay has held an average premium of A$144 over Victoria.

Our team covers a range of commodities, from goats to fertilizer. One of the agri products which we have not covered in much detail has been fodder due to the lack of available data. However we will now start to include the fodder market on a regular basis.

We would like to thank our friends at the Australian Fodder Industry Association (AFIA), who have provided us with datasets to assist in price reporting. This wouldn’t be possible without this data, and our analysis will help increase transparency for both farmers and buyers.

In this initial analysis we will examine the price structure of cereal hay market versus the wheat market. 
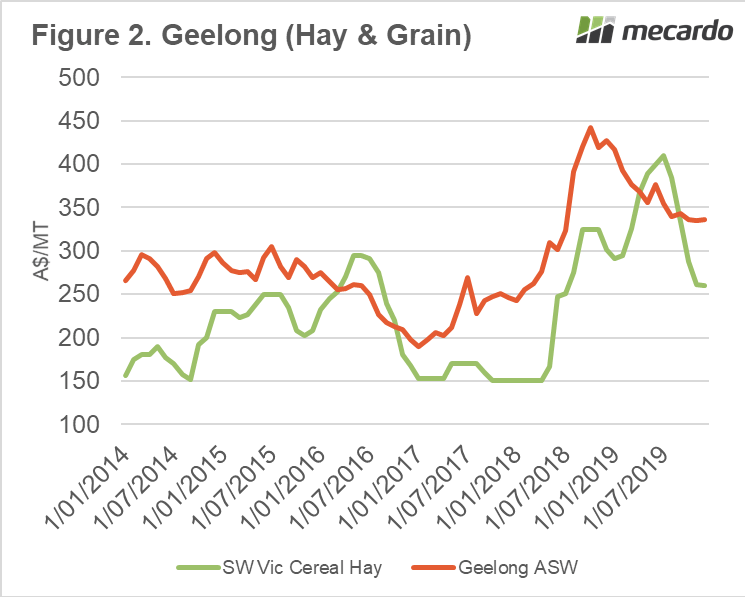
The focus is on the Darling Downs and Victoria. This is since the Darling Downs is the primary demand driver and Victoria is likely to be the supplier this season.

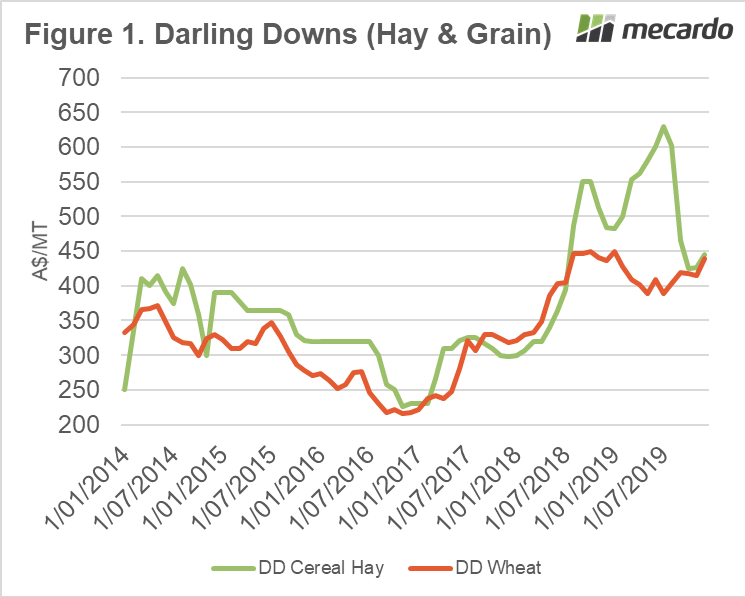
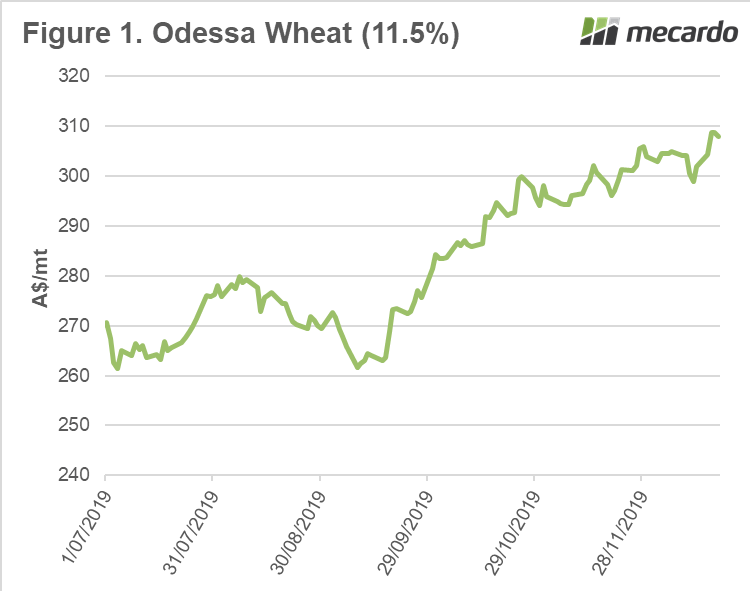
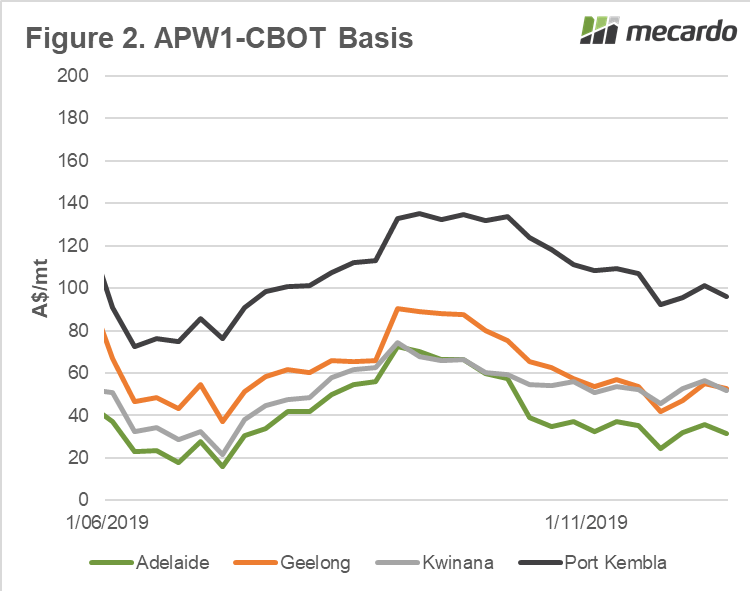
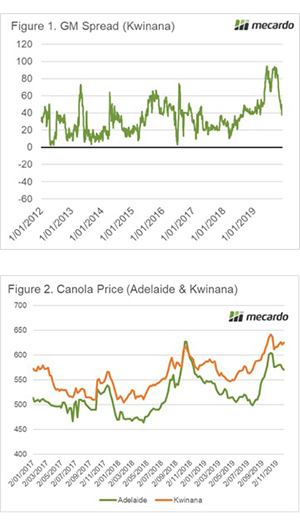
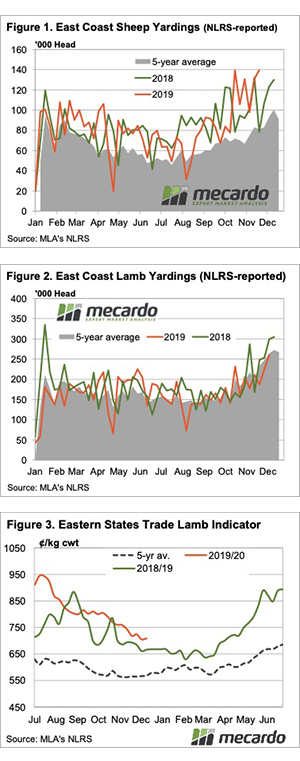
In figure 1 & 2, the cereal hay and wheat price for both areas are displayed. The price for both hay and grain has increased during the past two years due to the drought, however both have seen the market fall from last years highs.

There is a distinct difference however in both areas when it comes to the spread to wheat. On the Darling Downs cereal hay tends to trade at a premium to wheat, whereas in Victoria wheat trades at a premium.

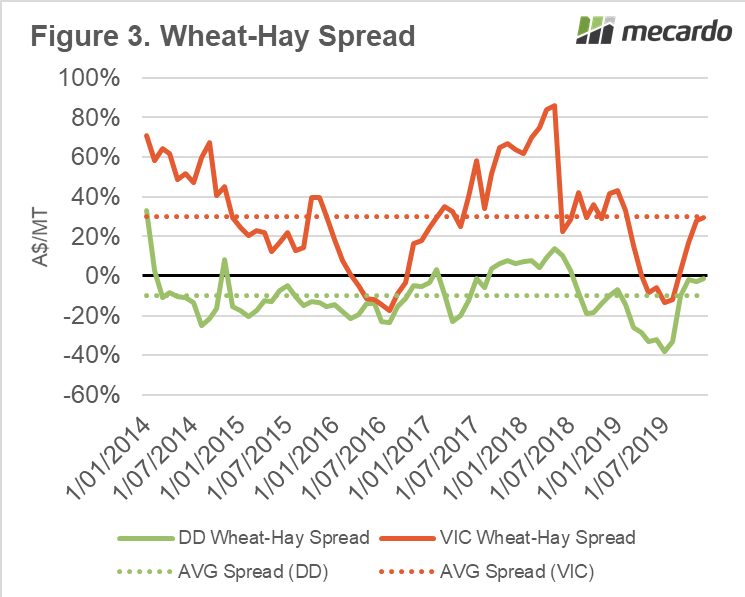
This spread is shown as a percentage since 2014 in figure 3. On average wheat is at 10% discount on the Darling Downs, whereas Victoria holds a 30% premium.

A large volume of hay is required for the numerous feedlot operations in QLD/NNSW. This is shown in the large premium for DD hay over Victorian, which has averaged A$144/mt since 2014 – which is approximately the freight required to supply from Victoria.

What does it mean next week?:

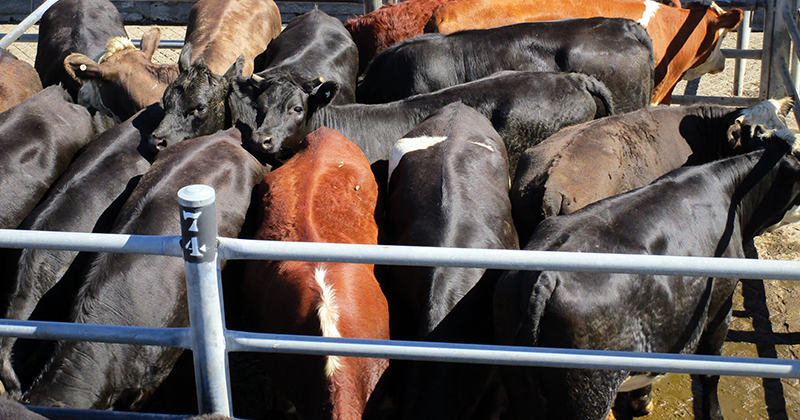
The large number of cattle feedlots in Queensland (and northern New South Wales) has resulted in strong premiums in Queensland for hay. This is exacerbated due to the drought conditions and the requirement to supply from Victoria.

In Queensland the hay market trades at a premium to wheat, which potentially points towards the replaceability of wheat with other feed materials (cottonseed/sorghum etc).

Finishing at a low but forecasting a better start

There is an argument to say you can’t take much notice of markets in the last week of trade before Christmas.  Buyers are winding down in anticipation of closures, and sellers generally try to avoid selling because of that.  Cattle producers will be hoping this week’s price declines aren’t indicative of what is to come in the New Year.

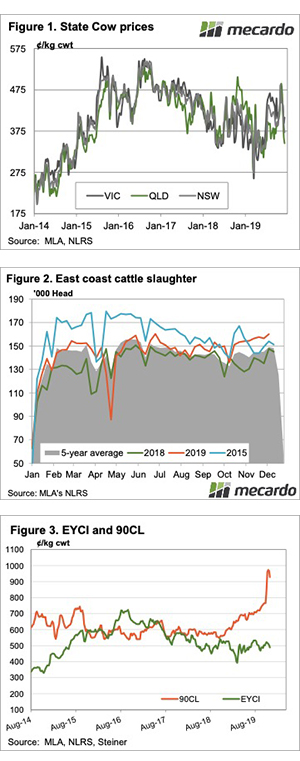
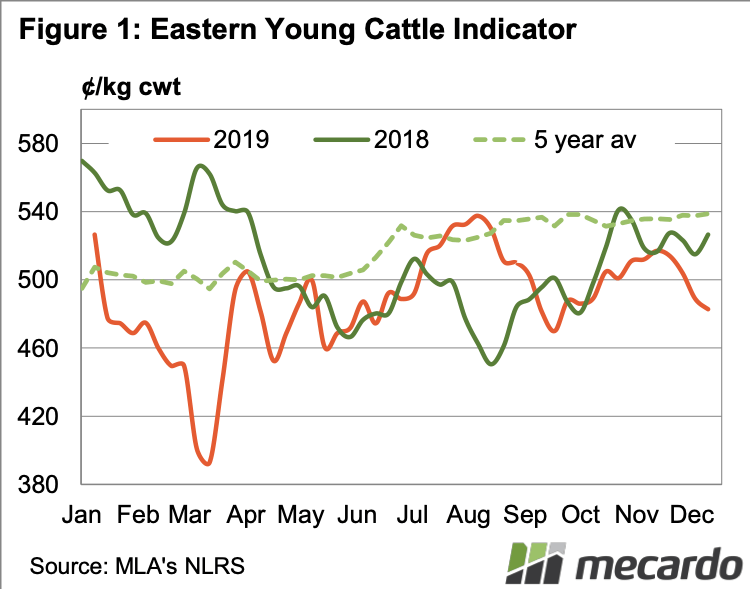
The Eastern Young Cattle Indicator (EYCI) has finished the year at a three month low, but it was on the back of yardings of just over 8,000 head.  Figure 1 shows the final price for 2019 of 482.75¢/kg cwt is now 44¢ behind where it ended 2018.

Since the heavy decline at the start of the year, the EYCI has made a slight improvement, but it will be interesting to see how the market opens up.

We only have slaughter numbers to the end of last week, and it has finished the year on a high. It isn’t unusual to see cattle slaughter hit a high in December, 
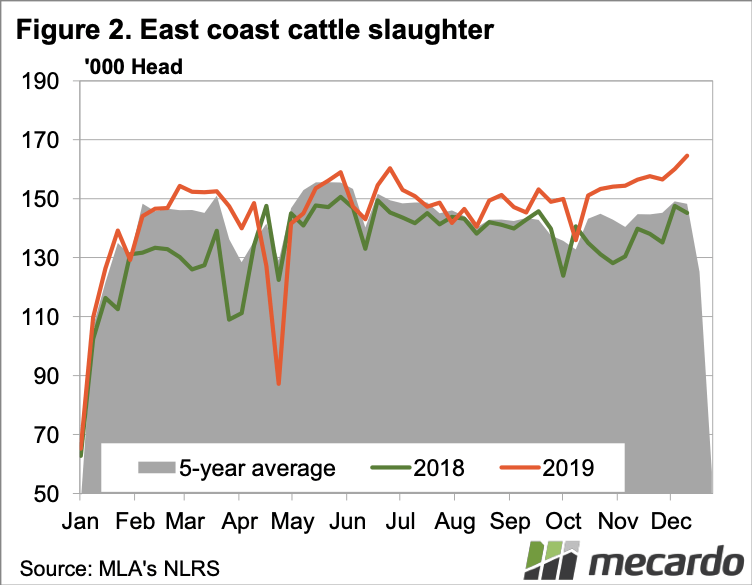
it is unusual for it to be the high for the year (figure 2).

The driver of the very strong cow prices we saw a month ago was export beef prices, and we are continuing to see that market correct.  The 90CL Frozen Cow Indicator isn’t back to the levels of six week ago, it has fallen 11% from the peaks.  Cow prices and the EYCI are still way off the 90CL level of 868¢/kg.

The week ahead.

The late news just said there is relief on way for Queensland in the New Year, and it seems they were referring to the latest three month outlook.  Figure 3 shows the mostly neutral outlook, which his better than we have seen for some time.  Basically there is a 50% chance of getting decent summer rain across the north.  It won’t be in time for Christmas, but would no doubt be a welcome start to 2020.

Santa brings higher pricing

Tis the season to be jolly. As we move into the festive period and Australia effectively closes shop for the next fortnight, we have seen a lift in pricing levels. In this update we take a look at black sea pricing and local basis levels.

The countries located on the black sea are increasingly important to the global wheat trade, and as many will be aware due to the recent drought in Australia have been competing into our traditional customers. What happens in the region will increasingly drive our pricing, especially when we return to years with larger exportable surpluses.

The price of wheat at the port of Odessa (Ukraine) has increased dramatically since September (figure 1). At present the market is at A$307/mt (free on board), which is up from A$272/mt at the start of September. At present the trade and growers in Russia and Ukraine are optimistic on pricing level, which has meant that volumes have dried up.

Interestingly, we are seeing a similar pattern in Australia. Grower selling pace in Australia has been lackluster, which has seen prices rise during the past fortnight or so. The rise in pricing has meant that growers are not in a huge rush to sell their grain.

Interestingly when we look at basis (the premium or discount versus futures) to Chicago, the premium over Chicago has only increased marginally since the end of November (figure 2).

  • Adelaide +$7
  • Geelong +$11
  • Kwinana +$6
  • Port Kembla +$4

The basis level gives a good indication of demand for grain and logically we would be expecting extremely high basis levels this year due to the overall lower crop production than last season. However, we are seeing closer to average basis levels especially in Victoria and South Australia. This points towards the buyers being less willing to bid up the market.

What does it mean next week?:

We won’t see much data out during the next week as most organizations close down for the Christmas break.

The real driver of pricing locally will be whether demand from consumers continues, and the crunch point when their appetite wanes.

It’s a joyful end to the year

The improved demand observed last week after successive falling weeks continued strongly in the last week of selling for 2019. Buyers found support from mills to bid strongly on another large offering, sending the market to the Christmas break in a positive mood.

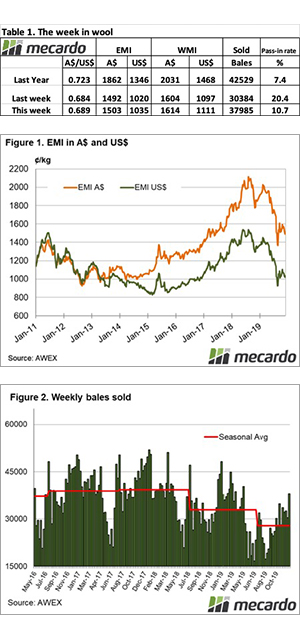
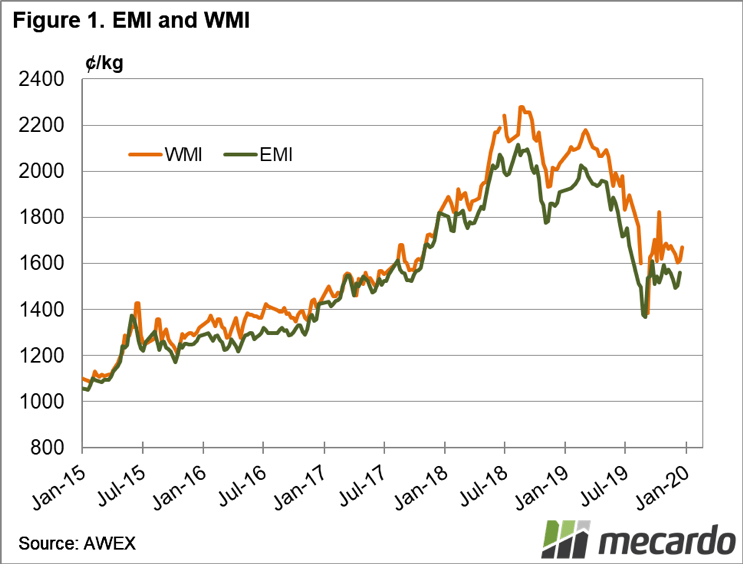
The Eastern Market Indicator (EMI) lifted 55 cents for the week to close at 1,558 cents. The AU$ gave up .05 cents to sit at US $0.645. In US terms, this pushed the EMI up 32 cents to 1,066 cents.

The Western Market Indicator had a good week gaining 57 cents for the week to finish at 1,671 cents. It was difficult to find a type that missed out, with AWEX reporting  rises across the MPG spectrum of 40 – 90 cents.

The national offering of 34,776 bales came forward. The pass in rate fell again to 7.7% nationally. This meant that 32,091 bales cleared to the trade. 
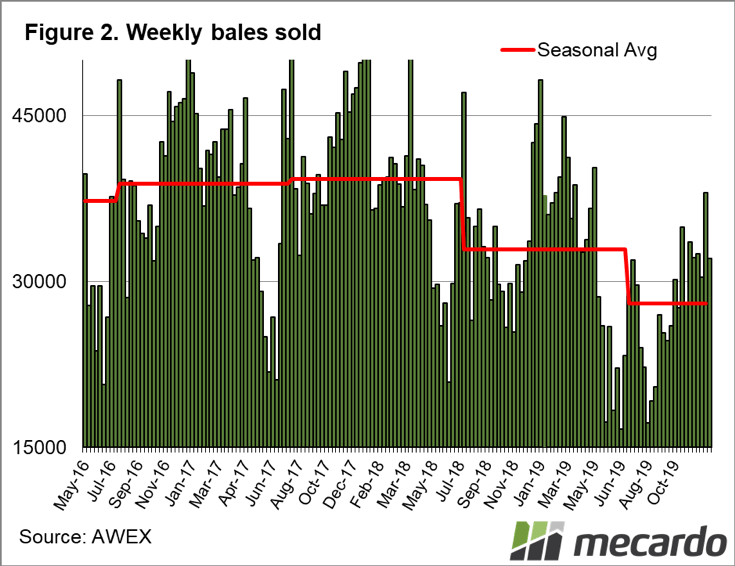
Bales sold were 5,895 bales fewer than last week, and 10,438 down on the last week in 2018. The total lag in bale clearance from this season to last is currently at a difference of 119,995 bales.

The dollar value for the week was $51.33 million, while the combined value so far this season is $1.059 billion. We noted last week the total turnover tipped over the billion dollar mark; for comparison this mark was achieved on 19th October in 2018, 2 months earlier.

While on the subject of Y on Y comparisons, the EMI was at 1862, almost 20% above todays level, while in US$ terms it was 26% higher. In fact as at the end of the first half of the selling season last year, wool had a $647 million higher turnover.

Unfortunately the first half of this selling season has seen fewer bales offered, a smaller clearance and lower prices compared to last year.

The crossbred types followed the strong merino lead and posted good gains in the 15 to 74 cent range, however cardings were quoted as having mixed results with Sydney & Fremantle dearer while Melbourne was slightly cheaper.

The week ahead

There is now a recess for Christmas; the positive finish provides optimism. In the first sales of 2019, 100,000 bales were offered while the EMI moved from 1862 to peak at 2027 by the end of February.

We wont see that much wool offered in the New Year, but we may see the rally continue.

Sales will resume on the week of the 13th of January.

Buyers check off their wish list

Processors appeared to tick off the Christmas list early this year, with plenty of supply to see sheep and lambs booked up. There was no last minute rush to fill orders, and prices took the hit, dropping back to levels not seen since April.

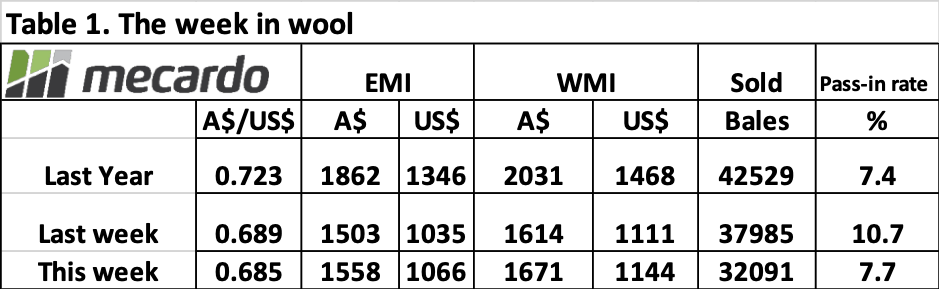
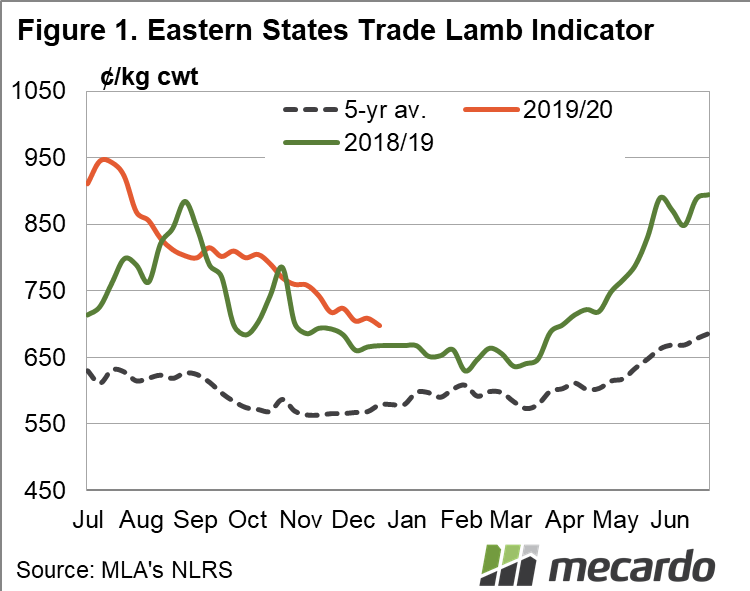
For the first time in 9 months the Eastern States Trade Lamb Indicator (ESTLI) dropped below the 700¢ threshold to end the week at 698¢. A hard number to swallow considering we’ve seen the ESTLI drop off nearly 250¢ from the record highs in July. That being said, this time last year the ESTLI was sitting at 668¢, so while the decline has been fast and hard, prices are still 4.5% higher than 2018.

Light lambs were the only category not to post a loss for the week, up 12¢ to 733¢/kg cwt. All other categories of lamb fell back 10 to 20¢. WA didn’t escape correction, with trade lambs losing 20¢.

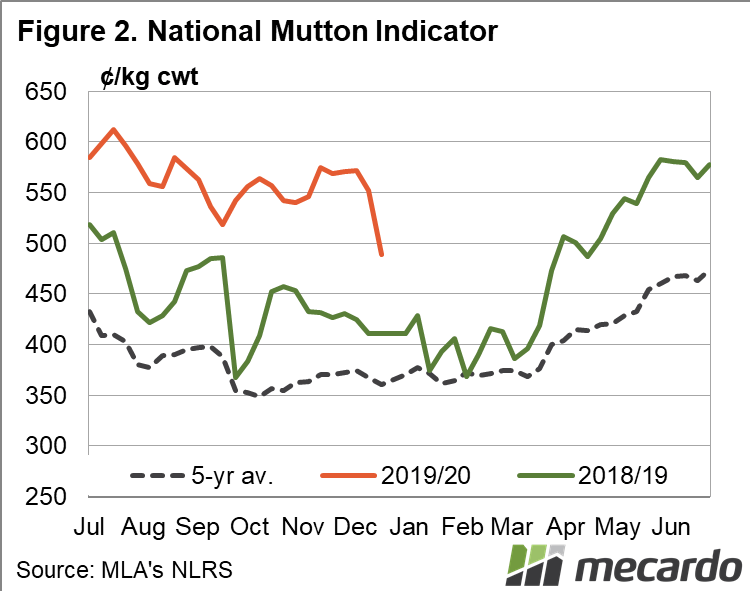
Mutton prices couldn’t hold on to finish the year at unbelievable levels. The National Mutton Indicator lost 79¢ on the week to close at 489¢. Another week of heavy mutton supply and the likely poor quality in NSW were the main drivers. All states contributed to the fall but NSW really took a dive. NSW mutton declined 13% on the week to 471¢/kg cwt.

It’s not difficult to guess why prices fell again this week looking at the yarding figures. East coast sheep yardings reached new records last week for the second week in a row. Weekly lamb yardings also edged higher on the east coast thanks to a big push in Victoria.

Next Week.

From what we’ve seen this week, sheep and lambs are pretty well booked up for the Christmas period and likely into early January. Things will quieten down now, but with no rain on the short term forecast above average throughput might continue into the New Year.

The price of GM crops

The South Australian government is debating a bill to end the moratorium on GM crop cultivation. I received information from a contact related to claims from anti-gm activists. I thought it was time to dispel some of the activist’s misunderstandings.

The Mecardo team produced a report on behalf of Grain Producers South Australia (GPSA) and the Agricultural Biotechnology Council of Australia (ABCA). This report was instrumental in removing some of the inaccuracies present in the debate when it comes to pricing.

The information we received was that farmers were avoiding GM crops in Western Australia due to the high premium (up to $100/mt). The reality is that in Western Australia >28% of the Canola crop has been GM in recent years, a considerable volume when you consider that GM is generally used as an agronomic tool for cleaning up paddocks.

In figure 1, the weekly average spread for GM to Non-GM in Kwinana is displayed. As we can see the claim of A$100 discount for GM is a bit of a reach. It has averaged close to A$100 at points during this year. However, it hasn’t stayed there for a particularly wrong period. The average discount for GM canola is A$31.

Co-existence is possible between GM and Non-GM. If it were not, we would be seeing very strong premiums in South Australia against Kwinana due to its GM-free status. However, we do not see this happening (figure 2).

The market never lies. If there was a substantive premium for canola produced in South Australia due to its GM-free status we would see it in the price.

What does it mean for next week?

It is important to understand that GM crops are part of a toolkit for farmers. The discount for GM canola is variable and market-driven.

It is true that there have been large discounts at times, however, it has been close to parity with Non-GM at numerous points over recent years. It is up to farmers to decide whether the agronomic benefits outweigh the discount.

It is important to note that many activists use the GM spread erroneously, depicting that introducing GM canola would result in all canola dropping in price. This is incorrect, it is important to compare apples for apples with Non-GM canola in states to determine if the GM-free status provides a premium for producers. It clearly doesn’t provide a premium.

“Spirited” bidding gives sellers an edge

The wool market is drawing close to the end of year recess and like many of us, exporters were spurred on to fill their orders to ensure they make shipping cutoffs. Demand kept slightly ahead of the increased supply, with most categories posting small increases on the week.

The Eastern Market Indicator (EMI) rose 11 cents for the week to close at 1,503 cents. The AU$ had another positive week, rising .05 cents to US $0.689. In US terms, this pushed the EMI up 14 cents to 1,035 cents.

The Western Market Indicator gained 10 cents for the week to finish at 1,614 cents. Mid micron fibres received most buyer interest, with prices 20 to 40 cents higher for the 20 and 21 MPGs. AWEX reported that all types and descriptions enjoyed the scramble for volumes.

The national offering was significantly higher this week with an extra 4,393 brought forward. The total offering was 42,542 bales. With the rising market, the pass in rate fell; back to 10.7%. This meant that 37,985 bales cleared to the trade. While this is the highest weekly volume of bales sold so far this season, it was still 4,544 bales fewer than the same week in 2018. The total lag in bale clearance from this season to last is currently at a difference of 107,825 bales.

The dollar value for the week was $61.89 million, with the average bale value sitting at $1,629, drifting 16 per bale below last week’s average. The combined value so far this season finally tipped over the billion-dollar mark to $1.007 billion.

The crossbred sector saw mixed results between selling centres. In Melbourne prices lifted by on average 20 cents while Sydney ranged from 15 cent losses to 7 cent gains for the 26 and 28 MPG respectively. The Merino Cardings Indicators defied the wider market again, but this time contracting, with losses of 15 to 20 cents.

The week ahead:

Next week is the last week of sale before the wool market breaks for Christmas recess. 39,430 bales are currently on the roster, with sale days on Tuesday and Wednesday across the three selling centres.

Sales will resume on the week of the 13th of January.

Ovine yardings reaching a peak

It is the time of year when lamb yardings reach their seasonal high, driven largely by Victoria.  It was Sheep that reached a record last week, however.  This is no surprise given the very good prices at a time of year when they usually hit their lows.

East coast sheep yardings reached a new record last week, but only just.  There were 139,490 head of sheep yarded last week (figure 1).  This was only 321 head more than five weeks ago, but it’s a number which hasn’t been seen in at least 12 years.

Strong sheep yardings are being somewhat offset by weaker than normal lamb yardings.  Figure 2 shows lamb yardings were 14% below the same week last year, but in reality, it depends a bit on how you match your weeks up.  It looks like lamb yardings might be a week behind last year, but we should know if we have seen ‘normal’ supply by the end of next week.

Trade and Heavy Lambs found a bit of strength this week, the Eastern States Trade Lamb Indicator (ESTLI) bouncing off 700¢ (figure 3).  The spread between NSW and Victoria still stands at around 40¢, while WA prices fell back under 700¢ after four consecutive weeks of rises.

The heavy mutton supply has seen buyers able to pull prices back slightly.  The east coast Mutton Indicator fell 13¢ to 568¢/kg cwt.  Opposite to lamb, mutton in NSW is cheaper than Victoria.  This is probably a quality issue.

Next Week:

With no rain on the forecast as we come into Christmas, expect some big yardings next week.  What it does to prices will depend on how many sheep and lambs are booked up for the workdays in the break, but recent contracts would suggest processors won’t be scrambling for supply.  The last week might this time see the lowest lamb price since April.

Roll up, roll up for the wheat rollercoaster

Up, down, side to side. The rollercoaster of the grain market continues to provide excitement. As harvest advances pricing levels have risen. In this week’s update we take a look at ASX pricing, WA forecasts, Trump deals, and UK elections.


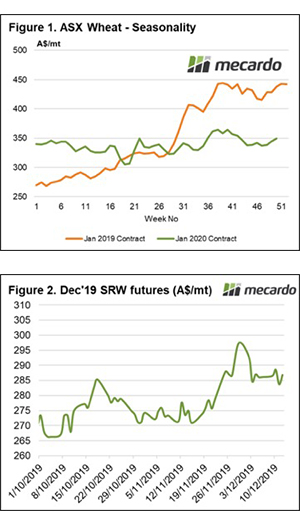
The ASX contract has risen dramatically during the past week, at the end of last week the December 2020 was trading at a weekly average of A$344 and has now moved up to A$349 (figure 1). There are concerns from feed consumers related to the slow pace of harvest in Victoria, which is driven both physical and futures levels higher.

The ASX swaps offered by banks are expiring during the next week, and we can clearly see that there are contracts being rolled from the January contract to May. This allows consumers to maintain cover for this season without having to convert to physical.

The Grain Industry Association of Western Australia released its updated crop forecasts. After a strong crop last year the crop has disappointed this season. The production estimates and month on month change are shown below:

  • Wheat 5.4mmt (-8%)
  • Barley 3.9mmt (+5.3%)
  • Canola 1.1mmt (+13.5%)
  • Oats 400kmt (-13.2%)

The GIWA results in the past have been generally quite accurate, however, after discussing with contacts in the west, these numbers have room for further downward revisions.

On an international level, we have seen US futures trading downward for most of this week, but we have seen a large rise overnight. This has been driven by comments from Trump related to positive trade talks with China.

It’s a bit like groundhog day now, where China and US get close to a resolution only for a last-minute pull back. At present, a limited agreement is on the cards which will prevent the new tariffs due to be implemented on Sunday.

This has driven the markets higher as the prospect of trade flows returning to normal. I believe that it will be a while until trade with China is back to normal and that these negotiations will likely continue for some time.

The UK went to the polls yesterday for the 3rd time in the past five years. The election has been one of the most contentious in recent years due to Brexit, with one side calling for further referendums and the other to get the deal done. The previous parliament was unable to reach agreements on the Brexit package after numerous votes, resulting in the current election.

As the voting booths close the exit polls are predicting a very strong conservative majority. If this eventuates, we will see a strong rally in the GBP.

Remember to listen to the  Commodity Conversation podcast by Mecardo

What does it mean? – Next week:

Feed demand remains strong at present with buyers looking to fulfill uncovered feeding requirements. This has provided a beneficial jump in values for producers. Whether this continues when grower selling increases is yet to be determined.

The record cow values didn’t last long

Just a month ago Cow prices were over 500¢, and almost the same price as the Eastern Young Cattle Indicator (EYCI).  This week cow prices continued to tank, while other cattle types largely held their ground.

Figure 1 shows state cattle indicators declining sharply since hitting a peak five weeks ago.  This week the Queensland Cow indicator fell a further 22¢ to hit a six month low. Dire weather conditions and another uninspiring forecast has seen cattle continue to move into the market.

Cattle slaughter hit another peak last week, moving to new highs not seen since 2015 (figure 2).  Yardings were lower last week on the back of the lower prices, but they are still very strong for this time of year.  This combined with plenty going direct, means processors don’t need to bid up at saleyards for supply.

Adding further price pressure was falling 90CL export prices.  After peaking at 968¢ two weeks ago, the 90CL has fallen 40¢, but figure 3 shows it is still way above historical levels.  The falls were largely due to buyers taking a break after Thanksgiving, but Steiner report there was little business done.

In WA cattle prices moved in opposite directions for young and old cattle.  The Western Young Cattle Indicator (WYCI) fell 37¢ to still a quite respectable 527¢/kg cwt.  Cow prices in the west were up 8¢, to 207¢/kg lwt.  Cows in the west are now at a premium to the east coast.

Next week

There is no rain on the forecast leading up to Christmas, which isn’t great news for prices.  We often see a large shift in cattle prices between years, as it either rains or it doesn’t.  Good northern rain would obviously see a strong move upwards, but forecasts don’t look promising.